Exponential family distributions | Conjugate prior distributions | Stable distributions | Continuous distributions | Location-scale family probability distributions | Normal distribution
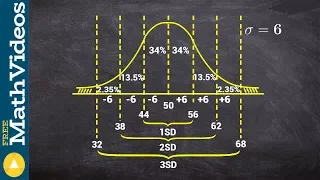
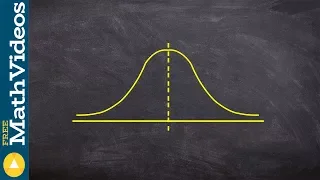
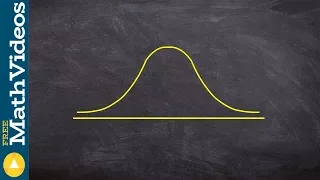
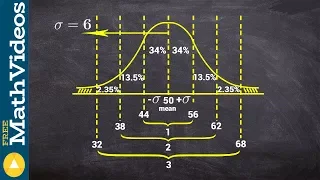
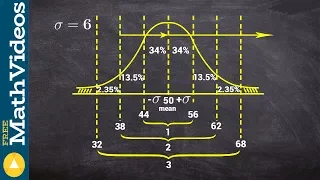
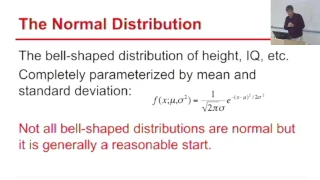
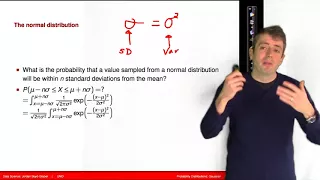
In statistics, a normal distribution or Gaussian distribution is a type of continuous probability distribution for a real-valued random variable. The general form of its probability density function is The parameter is the mean or expectation of the distribution (and also its median and mode), while the parameter is its standard deviation. The variance of the distribution is . A random variable with a Gaussian distribution is said to be normally distributed, and is called a normal deviate. Normal distributions are important in statistics and are often used in the natural and social sciences to represent real-valued random variables whose distributions are not known. Their importance is partly due to the central limit theorem. It states that, under some conditions, the average of many samples (observations) of a random variable with finite mean and variance is itself a random variable—whose distribution converges to a normal distribution as the number of samples increases. Therefore, physical quantities that are expected to be the sum of many independent processes, such as measurement errors, often have distributions that are nearly normal. Moreover, Gaussian distributions have some unique properties that are valuable in analytic studies. For instance, any linear combination of a fixed collection of normal deviates is a normal deviate. Many results and methods, such as propagation of uncertainty and least squares parameter fitting, can be derived analytically in explicit form when the relevant variables are normally distributed. A normal distribution is sometimes informally called a bell curve. However, many other distributions are bell-shaped (such as the Cauchy, Student's t, and logistic distributions). For other names, see . The univariate probability distribution is generalized for vectors in the multivariate normal distribution and for matrices in the matrix normal distribution. (Wikipedia).
The Normal Distribution (1 of 3: Introductory definition)
More resources available at www.misterwootube.com
From playlist The Normal Distribution
Using normal distribution to find the probability
👉 Learn how to find probability from a normal distribution curve. A set of data are said to be normally distributed if the set of data is symmetrical about the mean. The shape of a normal distribution curve is bell-shaped. The normal distribution curve is such that the mean is at the cente
From playlist Statistics
Order Graphs of a Normal Distribution by Standard Deviation
This video explains how to order graph from least to greatest based up the standard deviation.
From playlist The Normal Distribution
How to find the probability using a normal distribution curve
👉 Learn how to find probability from a normal distribution curve. A set of data are said to be normally distributed if the set of data is symmetrical about the mean. The shape of a normal distribution curve is bell-shaped. The normal distribution curve is such that the mean is at the cente
From playlist Statistics
Learn how to create a normal distribution curve given mean and standard deviation
👉 Learn how to find probability from a normal distribution curve. A set of data are said to be normally distributed if the set of data is symmetrical about the mean. The shape of a normal distribution curve is bell-shaped. The normal distribution curve is such that the mean is at the cente
From playlist Statistics
Learning to find the probability using normal distribution
👉 Learn how to find probability from a normal distribution curve. A set of data are said to be normally distributed if the set of data is symmetrical about the mean. The shape of a normal distribution curve is bell-shaped. The normal distribution curve is such that the mean is at the cente
From playlist Statistics
Learn how to use a normal distribution curve to find probability
👉 Learn how to find probability from a normal distribution curve. A set of data are said to be normally distributed if the set of data is symmetrical about the mean. The shape of a normal distribution curve is bell-shaped. The normal distribution curve is such that the mean is at the cente
From playlist Statistics
Normal Distribution and Empirical Rule With Examples Lesson
This video provides a lesson on the standard normal distribution and the Empirical Rule. http://mathispower4u.com
From playlist The Normal Distribution
Lecture 10 - Statistical Distributions
This is Lecture 10 of the CSE519 (Data Science) course taught by Professor Steven Skiena [http://www.cs.stonybrook.edu/~skiena/] at Stony Brook University in 2016. The lecture slides are available at: http://www.cs.stonybrook.edu/~skiena/519 More information may be found here: http://www
From playlist CSE519 - Data Science Fall 2016
ETH Lec 02. Data and Empirics II: Distributions (01/03/2012)
Course: ETH - Collective Dynamics of Firms (Spring 2012) From: ETH Zürich Source: http://www.video.ethz.ch/lectures/d-mtec/2012/spring/363-0543-00L/b0cfc537-1b86-4d4c-88c3-ce932c1156c1.html
From playlist ETH Zürich: Collective Dynamics of Firms (Spring 2012) | CosmoLearning.org Finance
Lec 5 | MIT 2.830J Control of Manufacturing Processes, S08
Lecture 5: Probability models, parameter estimation, and sampling Instructor: Duane Boning, David Hardt View the complete course at: http://ocw.mit.edu/2-830JS08 License: Creative Commons BY-NC-SA More information at http://ocw.mit.edu/terms More courses at http://ocw.mit.edu
From playlist MIT 2.830J, Control of Manufacturing Processes S08
CSE 519 -- Lecture 11, Fall 2020
From playlist CSE 519 -- Fall 2020
Year 13/A2 Statistics Chapter 3.4 3.5 (The Normal Distribution)
Since all normally-distributed variables form a 'family' of similarly-distributed data, these data can be standardised into what is called the Standard Normal Distribution which has μ = 0 and σ = 1. We change to the Standard Normal Distribution by 'coding', a skill we practised in Year 12.
From playlist Year 13/A2 Statistics
From playlist STAT 200 Video Lectures
Continuous Distributions: Gaussian
Video Lecture from the course INST 414: Advanced Data Science at UMD's iSchool. Full course information here: http://www.umiacs.umd.edu/~jbg/teaching/INST_414/
From playlist Advanced Data Science
Here I explain an idea that is confusing the first time you see it: a variable is lognormally distributed if its log (or natural log) is normally distributed. I use an example of future stock price: it the rate of return is normally distributed (it can be negative), the future stock price
From playlist Statistics: Distributions
FRM: Normal mixture distribution
A normal mixture distribution can model fat tails. For more financial risk videos, visit our website! http://www.bionicturtle.com
From playlist Statistics: Distributions
05 Data Analytics: Parametric Distributions
Lecture on parametric distributions, examples and applications. Follow along with the demonstration workflows in Python: o. Interactive visualization of parametric distributions: https://github.com/GeostatsGuy/PythonNumericalDemos/blob/master/Interactive_ParametricDistributions.ipynb o.
From playlist Data Analytics and Geostatistics
Find the probability of an event using a normal distribution curve
👉 Learn how to find probability from a normal distribution curve. A set of data are said to be normally distributed if the set of data is symmetrical about the mean. The shape of a normal distribution curve is bell-shaped. The normal distribution curve is such that the mean is at the cente
From playlist Statistics