

Brief overview of the standard error. What it represents and how you would find it with a formula.
From playlist Basic Statistics (Descriptive Statistics)

Statistics: Ch 7 Sample Variability (11 of 14) What is "The Standard Error of the Mean"?
Visit http://ilectureonline.com for more math and science lectures! To donate: http://www.ilectureonline.com/donate https://www.patreon.com/user?u=3236071 What is “the standard error of the mean”? It is the standard deviation (of the sampling distribution) of the sample means. Previous
From playlist STATISTICS CH 7 SAMPLE VARIABILILTY

Standard Error of the Estimate used in Regression Analysis (Mean Square Error)
An example of how to calculate the standard error of the estimate (Mean Square Error) used in simple linear regression analysis. This typically taught in statistics. Like us on: http://www.facebook.com/PartyMoreStud... Link to Playlist on Regression Analysis http://www.youtube.com/cour
From playlist Linear Regression.

Standard Error of the Mean: Let’s Talk About SEx (12-1)
The Standard error of the mean is the average variability between the sample mean and the population mean that is reasonable to expect simply by chance. It is to the Distribution of Sample Means what the standard deviation is to a single mean of a sample. As sample size increases, the stan
From playlist Sampling Distributions in Statistics (WK 12 - QBA 237)

How to calculate standard error for the sample mean
Standard error for the sample mean formula explained in simple steps.
From playlist Basic Statistics (Descriptive Statistics)

How to find the number of standard deviations that it takes to represent all the data
👉 Learn how to find the variance and standard deviation of a set of data. The variance of a set of data is a measure of spread/variation which measures how far a set of numbers is spread out from their average value. The standard deviation of a set of data is a measure of spread/variation
From playlist Variance and Standard Deviation
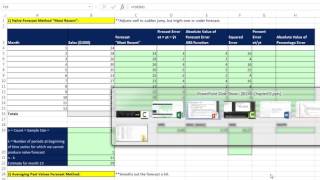
Basic Excel Business Analytics #54: Basic Forecasting Methods & Measures of Forecast Error
Download files: https://people.highline.edu/mgirvin/AllClasses/348/348/AllFilesBI348Analytics.htm Learn about some Basic Forecasting Methods: 1) (00 Intro to Time Series and Forecasting 2) (02:10) Naïve Method or Most Recent Method for Forecasting 3) (04:34) Forecast Error and Mean Foreca
From playlist Excel Business Analytics (Forecasting, Linear Programming, Simulation & more) Free Course at YouTube (75 Videos)

Recent advances in high dimensional robust statistics - Daniel Kane
Computer Science/Discrete Mathematics Seminar I Topic: Recent advances in high dimensional robust statistics Speaker: Daniel Kane, University of California, San Diego Date: December 11, 2017 For more videos, please visit http://video.ias.edu
From playlist Mathematics

Deep Learning Lecture 2.4 - Statistical Estimator Theory
Deep Learning Lecture - Estimator Theory 3: - Statistical Estimator Theory - Bias, Variance and Noise - Results for Linear Least Square Regression
From playlist Deep Learning Lecture

Linear regression (3): Normal equations
Closed form solution for mean squared error; normal equations; robustness and other losses
From playlist cs273a
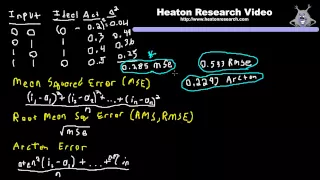
Neural Network Training (Part 2): Neural Network Error Calculation
From http://www.heatonresearch.com. An important part of the training process is error calculation. In this video, see how errors are calculated.
From playlist Neural Networks by Jeff Heaton
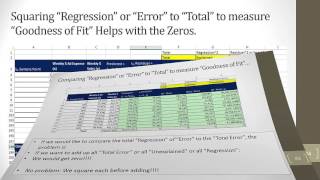
Basic Excel Business Analytics #47: SST = SSR + SSE & R Squared & Standard Error of Estimate
Download files: https://people.highline.edu/mgirvin/AllClasses/348/348/AllFilesBI348Analytics.htm Learn: 1) (00:14) What we will do in this video: SST, SSR, SSE, R^2 and Standard Error 2) (00:44) What we did last video 3) (01:11) How do we think about “How good our Estimated Regression Li
From playlist Excel Business Analytics (Forecasting, Linear Programming, Simulation & more) Free Course at YouTube (75 Videos)

Uncertainty propagation b: Sample estimates
(C) 2012-2013 David Liao (lookatphysics.com) CC-BY-SA Standard deviation vs. sample standard deviation Mean vs. sample mean Standard deviation of the mean vs. standard error of the mean Rule of thumb for thinking about whether error bars overlap
From playlist Probability, statistics, and stochastic processes

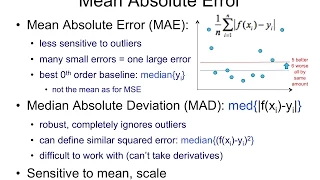
Mean Squared Error | What Is Mean Squared Error? | Probability And Statistics | Simplilearn
In this Probability and Statistics tutorial, you will learn one of the key metrics of Machine Learning, i.e., Mean Squared Error. Then, we will learn how to calculate the mean square error and why it is helpful with the help of an example. 🔥Free Data Science Course with Completion Certifi

Mod-12 Lec-33 Regression Models with Autocorrelated Errors
Regression Analysis by Dr. Soumen Maity,Department of Mathematics,IIT Kharagpur.For more details on NPTEL visit http://nptel.ac.in
From playlist IIT Kharagpur: Regression Analysis | CosmoLearning.org Mathematics
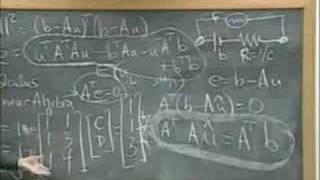
Lec 4 | MIT 18.085 Computational Science and Engineering I
Applications to linear estimation: least squares A more recent version of this course is available at: http://ocw.mit.edu/18-085f08 License: Creative Commons BY-NC-SA More information at http://ocw.mit.edu/terms More courses at http://ocw.mit.edu
From playlist MIT 18.085 Computational Science & Engineering I, Fall 2007

How to find the variance and standard deviation from a set of data
👉 Learn how to find the variance and standard deviation of a set of data. The variance of a set of data is a measure of spread/variation which measures how far a set of numbers is spread out from their average value. The standard deviation of a set of data is a measure of spread/variation
From playlist Variance and Standard Deviation