
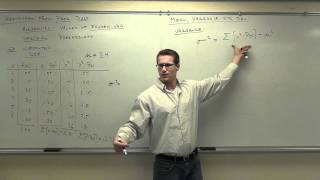
Statistics Lecture 3.3: Finding the Standard Deviation of a Data Set
https://www.patreon.com/ProfessorLeonard Statistics Lecture 3.3: Finding the Standard Deviation of a Data Set
From playlist Statistics (Full Length Videos)

This video explains how to determine mean, median and mode. It also provided examples. http://mathispower4u.yolasite.com/
From playlist Statistics: Describing Data

Statistic vs Parameter & Population vs Sample
This stats video tutorial explains the difference between a statistic and a parameter. It also discusses the difference between the population and sample. It includes examples such as the sample mean, population mean, sample standard deviation, population standard deviation, sample propo
From playlist Statistics

Finding a Standardized Test Statistic
How to calculate a standardized test statistic.
From playlist Normal Distributions
Statistics Lecture 5.2: A Study of Probability Distributions, Mean, and Standard Deviation
https://www.patreon.com/ProfessorLeonard Statistics Lecture 5.2: A Study of Probability Distributions, Mean, and Standard Deviation
From playlist Statistics (Full Length Videos)

How the F Statistic is used in ANOVA and Regression. How the p-value needs to be considered along with an F-value in your test results.
From playlist Hypothesis Tests and Critical Values

Find x given the z-score, sample mean, and sample standard deviation
Please Subscribe here, thank you!!! https://goo.gl/JQ8Nys Find x given the z-score, sample mean, and sample standard deviation
From playlist Statistics

Statistics: Ch 9 Hypothesis Testing (7 of 35) What is the Test Statistics?
Visit http://ilectureonline.com for more math and science lectures! To donate: http://www.ilectureonline.com/donate https://www.patreon.com/user?u=3236071 We will learn the Test Statistic is the random variable (derive from a random sample) used to make the decision to: A) not reject the
From playlist STATISTICS CH 9 HYPOTHESIS TESTING
Hypothesis Tests AS Level Maths Statistics Exam Questions 4
AS Level Maths Statistics Exam Questions on hypothesis tests with binomial distribution, from AQA, Edexcel and OCR MEI, perfect revision and practice for your AS Maths exams and A Level Maths year 1! Statistical hypothesis testing is a huge part of statistics in A Level Maths, and you'll
From playlist Hypothesis Tests AS Level Maths Statistics Exam Questions
Statistics For Data Science | Data Science Tutorial | Simplilearn
🔥 Advanced Certificate Program In Data Science: https://www.simplilearn.com/pgp-data-science-certification-bootcamp-program?utm_campaign=StatisticsForDataScience-Lv0xcdeXaGU&utm_medium=DescriptionFirstFold&utm_source=youtube 🔥 Data Science Bootcamp (US Only): https://www.simplilearn.com/da
From playlist Data Science For Beginners | Data Science Tutorial🔥[2022 Updated]

This video lesson is part of a complete course on neuroscience time series analyses. The full course includes - over 47 hours of video instruction - lots and lots of MATLAB exercises and problem sets - access to a dedicated Q&A forum. You can find out more here: https://www.udemy.
From playlist NEW ANTS #5) Permutation-based statistics
Test Statistics: Crash Course Statistics #26
Test statistics allow us to quantify how close things are to our expectations or theories. Instead of going on our gut feelings, they allow us to add a little mathematical rigor when asking the question: “Is this random… or real?” Today, we’ll introduce some examples using both t-tests and
From playlist Statistics
Table of Contents: 00:50 - Lecture structure Two Proportions 01:11 - Checking assumptions 02:50 - Computing the standard error by hand 03:59 - Example: Computing the standard error for a confidence interval 06:22 - Example: Computing the standard error for a hypothesis test 08
From playlist STAT 200 Video Lectures

07b Data Analytics: Hypothesis Testing
Lecture on hypothesis testing.
From playlist Data Analytics and Geostatistics
From playlist STAT 200 Video Lectures

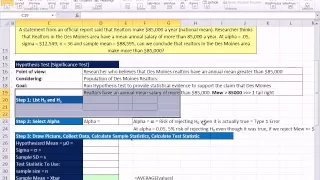
Excel Statistical Analysis 43: Hypothesis Testing: P-value & Critical Value Methods: 1 Tail Upper
Download Excel File: https://excelisfun.net/files/Ch09-ESA.xlsm Download 2 PDF note files: https://excelisfun.net/files/Ch09-ESA.pdf, https://excelisfun.net/files/Ch09-ESA-JustFormulas.pdf Learn about the 5 steps in hypothesis testing. Learn how to run a hypothesis test in Excel. Topics
From playlist Excel Statistical Analysis for Business Class Playlist of Videos from excelisfun

From playlist STAT 200 Video Lectures
Excel 2010 Statistics 78: Hypothesis Testing Population Mean, P-value & Critical Value, 1 Tail Right
Download Excel File #1: https://people.highline.edu/mgirvin/AllClasses/210Excel2010/Content/Ch09/Busn210ch09-First.xlsm Download Excel File #2: https://people.highline.edu/mgirvin/AllClasses/210Excel2010/Content/Ch09/Busn210ch09-Second.xlsm Download pdf file #1: https://people.highline.edu
From playlist Excel 2010 Statistics Formulas Functions Charts PivotTables

Hypothesis Tests AS Level Maths Statistics Exam Questions 2
AS Level Maths Statistics Exam Questions on hypothesis tests with binomial distribution, from AQA, Edexcel and OCR MEI, perfect revision and practice for your AS Maths exams and A Level Maths year 1! Statistical hypothesis testing is a huge part of statistics in A Level Maths, and you'll
From playlist Hypothesis Tests AS Level Maths Statistics Exam Questions

Excel 2013 Statistical Analysis #53: 5 Steps Hypothesis Testing: P-value & Critical Value Methods
Download files (which file shown at begin of video): https://people.highline.edu/mgirvin/AllClasses/210Excel2013/Ch09/Ch09.htm Topics in this video: 1. (00:39) Define Hypothesis Testing and example of questions we can ask. 2. (07:13) 5 Steps in Hypothesis Testing 3. (08:30) Review of varia
From playlist Excel for Statistical Analysis in Business & Economics Free Course at YouTube (75 Videos)