Exponential family distributions | Normal distribution | Continuous distributions | Non-Newtonian calculus
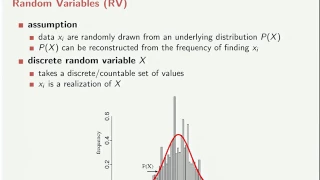
In probability theory, a log-normal (or lognormal) distribution is a continuous probability distribution of a random variable whose logarithm is normally distributed. Thus, if the random variable X is log-normally distributed, then Y = ln(X) has a normal distribution. Equivalently, if Y has a normal distribution, then the exponential function of Y, X = exp(Y), has a log-normal distribution. A random variable which is log-normally distributed takes only positive real values. It is a convenient and useful model for measurements in exact and engineering sciences, as well as medicine, economics and other topics (e.g., energies, concentrations, lengths, prices of financial instruments, and other metrics). The distribution is occasionally referred to as the Galton distribution or Galton's distribution, after Francis Galton. The log-normal distribution has also been associated with other names, such as McAlister, Gibrat and Cobb–Douglas. A log-normal process is the statistical realization of the multiplicative product of many independent random variables, each of which is positive. This is justified by considering the central limit theorem in the log domain (sometimes called Gibrat's law). The log-normal distribution is the maximum entropy probability distribution for a random variate X—for which the mean and variance of ln(X) are specified. (Wikipedia).
The Normal Distribution (1 of 3: Introductory definition)
More resources available at www.misterwootube.com
From playlist The Normal Distribution
Normal Distribution: Find Probability Given Z-scores Using a Free Online Calculator
This video explains how to determine normal distribution probabilities given z-scores using a free online calculator. http://dlippman.imathas.com/graphcalc/graphcalc.html
From playlist The Normal Distribution
Using normal distribution to find the probability
👉 Learn how to find probability from a normal distribution curve. A set of data are said to be normally distributed if the set of data is symmetrical about the mean. The shape of a normal distribution curve is bell-shaped. The normal distribution curve is such that the mean is at the cente
From playlist Statistics
Determining values of a variable at a particular percentile in a normal distribution
From playlist Unit 2: Normal Distributions
How to find the probability using a normal distribution curve
👉 Learn how to find probability from a normal distribution curve. A set of data are said to be normally distributed if the set of data is symmetrical about the mean. The shape of a normal distribution curve is bell-shaped. The normal distribution curve is such that the mean is at the cente
From playlist Statistics
Normal Distribution: Find Probability Given Z-scores Using a Free Online Calculator (MOER/MathAS)
This video explains how to determine normal distribution probabilities given z-scores using a free online calculator. https://oervm.s3-us-west-2.amazonaws.com/stats/probs.html
From playlist The Normal Distribution
Find the probability of an event using a normal distribution curve
👉 Learn how to find probability from a normal distribution curve. A set of data are said to be normally distributed if the set of data is symmetrical about the mean. The shape of a normal distribution curve is bell-shaped. The normal distribution curve is such that the mean is at the cente
From playlist Statistics
Learning to find the probability using normal distribution
👉 Learn how to find probability from a normal distribution curve. A set of data are said to be normally distributed if the set of data is symmetrical about the mean. The shape of a normal distribution curve is bell-shaped. The normal distribution curve is such that the mean is at the cente
From playlist Statistics
Here I explain an idea that is confusing the first time you see it: a variable is lognormally distributed if its log (or natural log) is normally distributed. I use an example of future stock price: it the rate of return is normally distributed (it can be negative), the future stock price
From playlist Statistics: Distributions
ETH Lec 02. Data and Empirics II: Distributions (01/03/2012)
Course: ETH - Collective Dynamics of Firms (Spring 2012) From: ETH Zürich Source: http://www.video.ethz.ch/lectures/d-mtec/2012/spring/363-0543-00L/b0cfc537-1b86-4d4c-88c3-ce932c1156c1.html
From playlist ETH Zürich: Collective Dynamics of Firms (Spring 2012) | CosmoLearning.org Finance
ETH Lec 06. Stochastic Growth Models I (29/03/2012)
Course: ETH - Collective Dynamics of Firms (Spring 2012) From: ETH Zürich Source: http://www.video.ethz.ch/lectures/d-mtec/2012/spring/363-0543-00L/b0cfc537-1b86-4d4c-88c3-ce932c1156c1.html
From playlist ETH Zürich: Collective Dynamics of Firms (Spring 2012) | CosmoLearning.org Finance
Lognormal value at risk (VaR, FRM T5-01)
Welcome to the first video in this new playlist that is devoted to Topic 5 in the FRM. Topic 5, Market Risk, is the first topic in Part 2. We will start here by comparing normal to lognormal VaR and, specifically, we are going to generalize to absolute VaR. Absolute VaR generalizes the rel
From playlist Market Risk (FRM Topic 5)
LogTransformations.1.Why Log Transformations for Parametric
This video is brought to you by the Quantitative Analysis Institute at Wellesley College. The material is best viewed as part of the online resources that organize the content and include questions for checking understanding: https://www.wellesley.edu/qai/onlineresources
From playlist Applied Data Analysis and Statistical Inference
05 Data Analytics: Parametric Distributions
Lecture on parametric distributions, examples and applications. Follow along with the demonstration workflows in Python: o. Interactive visualization of parametric distributions: https://github.com/GeostatsGuy/PythonNumericalDemos/blob/master/Interactive_ParametricDistributions.ipynb o.
From playlist Data Analytics and Geostatistics
Math 176. Math of Finance. Lecture 10.
UCI Math 176: Math of Finance (Fall 2014) Lec 10. Math of Finance View the complete course: http://ocw.uci.edu/courses/math_176_math_of_finance.html Instructor: Donald Saari, Ph.D. License: Creative Commons CC-BY-SA Terms of Use: http://ocw.uci.edu/info More courses at http://ocw.uci.edu
From playlist Math 176: Math of Finance
Lognormal property of stock prices assumed by Black-Scholes (FRM T4-10)
Although the Black-Scholes option pricing model makes several assumptions, the most important is the first assumption that stock prices follow a lognormal distribution (and that volatility is constant). Specifically, the model assumes that log RETURNS (aka, continuously compounded returns)
From playlist Valuation and RIsk Models (FRM Topic 4)
QRM 4-4: Tails in Data - Zipf Plot and Meplot
Welcome to Quantitative Risk Management (QRM). We close Lesson 4 by introducing some first tools for the graphical analysis of tails. We will deal with the exponential QQ-plot, the Zipf plot, the Fractality plot and the Meplot. More details will then follow in Lesson 5. Topics: 00:00 Int
From playlist Quantitative Risk Management
Learn how to use a normal distribution curve to find probability
👉 Learn how to find probability from a normal distribution curve. A set of data are said to be normally distributed if the set of data is symmetrical about the mean. The shape of a normal distribution curve is bell-shaped. The normal distribution curve is such that the mean is at the cente
From playlist Statistics