Summary statistics | Statistical deviation and dispersion
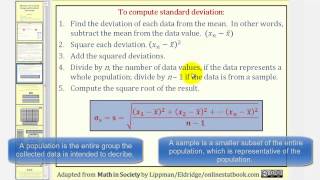
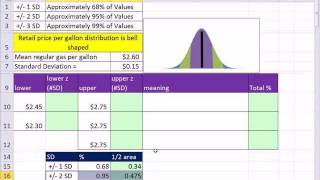
In statistics, the standard deviation is a measure of the amount of variation or dispersion of a set of values. A low standard deviation indicates that the values tend to be close to the mean (also called the expected value) of the set, while a high standard deviation indicates that the values are spread out over a wider range. Standard deviation may be abbreviated SD, and is most commonly represented in mathematical texts and equations by the lower case Greek letter ฯ (sigma), for the population standard deviation, or the Latin letter s, for the sample standard deviation. The standard deviation of a random variable, sample, statistical population, data set, or probability distribution is the square root of its variance. It is algebraically simpler, though in practice less robust, than the average absolute deviation. A useful property of the standard deviation is that, unlike the variance, it is expressed in the same unit as the data. The standard deviation of a population or sample and the standard error of a statistic (e.g., of the sample mean) are quite different, but related. The sample mean's standard error is the standard deviation of the set of means that would be found by drawing an infinite number of repeated samples from the population and computing a mean for each sample. The mean's standard error turns out to equal the population standard deviation divided by the square root of the sample size, and is estimated by using the sample standard deviation divided by the square root of the sample size. For example, a poll's standard error (what is reported as the margin of error of the poll), is the expected standard deviation of the estimated mean if the same poll were to be conducted multiple times. Thus, the standard error estimates the standard deviation of an estimate, which itself measures how much the estimate depends on the particular sample that was taken from the population. In science, it is common to report both the standard deviation of the data (as a summary statistic) and the standard error of the estimate (as a measure of potential error in the findings). By convention, only effects more than two standard errors away from a null expectation are considered "statistically significant", a safeguard against spurious conclusion that is really due to random sampling error. When only a sample of data from a population is available, the term standard deviation of the sample or sample standard deviation can refer to either the above-mentioned quantity as applied to those data, or to a modified quantity that is an unbiased estimate of the population standard deviation (the standard deviation of the entire population). (Wikipedia).
How to calculate Mean and Standard Deviation
A review of average and standard deviation Like us on: http://www.facebook.com/PartyMoreStudyLess
From playlist Standard Deviation
How To Calculate The Standard Deviation In Excel
This video tutorial explains how to calculate the standard deviation in excel. It also discusses the concept of standard deviation which is the dispersion or variability of the data around the mean.
From playlist Excel Tutorial
Measuring Variation: Range and Standard Deviation
This lesson explains how to determine the range and standard deviation for a set of data. Site: http://mathispower4u.com
From playlist Statistics: Describing Data
Ex: Calculate the Sample Standard Deviation
This video explains how to calculator the sample standard deviation of a data set. http://mathispower4u.com
From playlist Statistics: Describing Data
Learning how to find the variance and standard deviation from a set of data
๐ Learn how to find the variance and standard deviation of a set of data. The variance of a set of data is a measure of spread/variation which measures how far a set of numbers is spread out from their average value. The standard deviation of a set of data is a measure of spread/variation
From playlist Variance and Standard Deviation
Statistics Lecture 3.3: Finding the Standard Deviation of a Data Set
https://www.patreon.com/ProfessorLeonard Statistics Lecture 3.3: Finding the Standard Deviation of a Data Set
From playlist Statistics (Full Length Videos)
How to find the number of standard deviations that it takes to represent all the data
๐ Learn how to find the variance and standard deviation of a set of data. The variance of a set of data is a measure of spread/variation which measures how far a set of numbers is spread out from their average value. The standard deviation of a set of data is a measure of spread/variation
From playlist Variance and Standard Deviation
How to find the variance and standard deviation from a set of data
๐ Learn how to find the variance and standard deviation of a set of data. The variance of a set of data is a measure of spread/variation which measures how far a set of numbers is spread out from their average value. The standard deviation of a set of data is a measure of spread/variation
From playlist Variance and Standard Deviation
The dispersion of data by means of the standard deviation.
From playlist Medical Statistics
Download file: https://people.highline.edu/mgirvin/AllClasses/210Excel2013/Ch03/Excel2013StatisticsChapter03.xlsm Topics in this video: 1. (00:09) Calculate z score. Z Score is the Number of Standard Deviations a particular value is away from the mean. Deviation divided by Standard Deviati
From playlist Excel for Statistical Analysis in Business & Economics Free Course at YouTube (75 Videos)
Excel Statistical Analysis 14: Z-Score, Empirical Rule , Chebyshev Theorem: # of Standard Deviations
Download Excel File: https://excelisfun.net/files/Ch03-ESA.xlsm Learn about the z-score (number of standard deviations) and how to calculate it and use it in the Empirical Rule and Chebyshev's Theorem. Topics: 1. (00:00) Introduction to Z-Score 2. (01:23) Basics of Z-Score Calculations usi
From playlist Excel Statistical Analysis for Business Class Playlist of Videos from excelisfun
Chapter 2.2: Range, Standard Deviation, and Variance
Chapter 2.2 from "Introduction to Statistics, Think & Do" by Scott Stevens (http://www.StevensStats.com) Textbook from Publisher, $29.95 print, $9.95 PDF http://www.centerofmathematics.com/wwcomstore/index.php/thinkdov4-1.html Textbook from Amazon: https://amzn.to/2zJRCjL
From playlist Statistics Lecture Videos
Normal Distribution and Empirical Rule With Examples Lesson
This video provides a lesson on the standard normal distribution and the Empirical Rule. http://mathispower4u.com
From playlist The Normal Distribution
Excel 2010 Statistics #31: z-Scores, Chebyshev's Theorem and Empirical Rule
Download Excel File #1: https://people.highline.edu/mgirvin/AllClasses/210Excel2010/Content/Ch03/Excel2010StatisticsCh03correct.xlsm Download Excel File #2: https://people.highline.edu/mgirvin/AllClasses/210Excel2010/Content/Ch03/Excel2010StatisticsCh03SecondFile.xlsm Download Excel File #
From playlist Excel 2010 Statistics Formulas Functions Charts PivotTables
Excel Statistical Analysis 13: Range, Variance, Standard Deviation, Coefficient of Variation
Download Excel File: https://excelisfun.net/files/Ch03-ESA.xlsm Learn about how to use measures of variations to make decisions. Learn about variation visually, then learn how to calculate these measures of variation: Range, Variance, Standard Deviation, Coefficient of Variation. Topics: 1
From playlist Excel Statistical Analysis for Business Class Playlist of Videos from excelisfun
Basic Excel Business Analytics #23: Variability: Variance, Standard Deviation, Z-score and more
Download files: https://people.highline.edu/mgirvin/AllClasses/348/348/AllFilesBI348Analytics.htm Learn about a number of important calculations for Variability: 1) (00:11) What is Variability? Synonyms: Variation, Dispersion, Spread in the data. Which Mean more fairly represents its data
From playlist Excel Business Analytics (Forecasting, Linear Programming, Simulation & more) Free Course at YouTube (75 Videos)
Excel 2013 Statistical Analysis #20: Standard Deviation: How Fairly Does Mean Represent Data Points?
Download file: https://people.highline.edu/mgirvin/AllClasses/210Excel2013/Ch03/Excel2013StatisticsChapter03.xlsm Topics in this video are about Variation, Dispersion, Spread in the Data and Standard Deviation: 1. (00:09) Three data sets and charts of each to illustrate the concept of Vari
From playlist Excel for Statistical Analysis in Business & Economics Free Course at YouTube (75 Videos)
Brief overview of the standard error. What it represents and how you would find it with a formula.
From playlist Basic Statistics (Descriptive Statistics)
The standard error, Clearly Explained!!!
This StatQuest explains what the standard error is and then it shows how it can be calculated with bootstrapping. There is a minor error at 10:22: The bar that represents the mean is in the wrong location. It should be at -0.3. For a complete index of all the StatQuest videos, check out
From playlist StatQuest