Normal distribution | Mathematical tables

Standard normal table

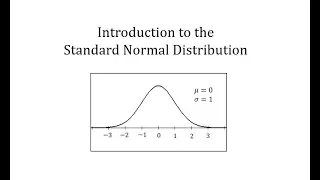
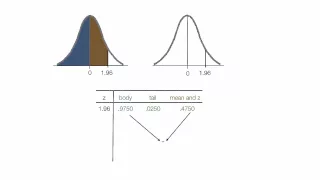
A standard normal table, also called the unit normal table or Z table, is a mathematical table for the values of Φ, which are the values of the cumulative distribution function of the normal distribution. It is used to find the probability that a statistic is observed below, above, or between values on the standard normal distribution, and by extension, any normal distribution. Since probability tables cannot be printed for every normal distribution, as there are an infinite variety of normal distributions, it is common practice to convert a normal to a standard normal and then use the standard normal table to find probabilities. (Wikipedia).

Standard normal table
Video thumbnail

Statistics Lecture 6.3: The Standard Normal Distribution. Using z-score, Standard Score

https://www.patreon.com/ProfessorLeonard Statistics Lecture 6.3: Applications of the Standard Normal Distribution. Using z-score, Standard Score

From playlist Statistics (Full Length Videos)

Video thumbnail

How to use Normalized Tables Z Scores (Standard Table)

Tutorial on understanding normalized tables and how it relates to z scores and the bell curve. Includes an example of extrapolation. Normal Tables are used in statistics classes. Like us on: http://www.facebook.com/PartyMoreStudyLess Created by David Longstreet, Professor of the Univers

From playlist Normalized Tables Z Scores Bell Curve Normal Table

Video thumbnail

The Normal Distribution (1 of 3: Introductory definition)

More resources available at www.misterwootube.com

From playlist The Normal Distribution

Video thumbnail

What is a z table

Explains how the z-table is used to find an area under a bell curve.

From playlist Normal Distributions

Video thumbnail

Introduction to the Standard Normal Distribution

This video introduces the standard normal distribution http://mathispower4u.com

From playlist The Normal Distribution

Video thumbnail

How to look up Normalized Tables z scores Standard Normal Curve Table

How to look up z scores in the back of your statistics text book (bell curve) in a normalized table. Like us on: http://www.facebook.com/PartyMoreStudyLess

From playlist Normalized Tables Z Scores Bell Curve Normal Table

Video thumbnail

Standard Normal Distribution Tables, Z Scores, Probability & Empirical Rule - Stats

This statistics video tutorial provides a basic introduction into standard normal distributions. It explains how to find the Z-score given a value of x as well as the mean and standard deviation. It explains how to determine the probability by finding the area under the curve represented

From playlist Statistics

Video thumbnail

The Normal Distribution (3 of 3: Basic questions)

More resources available at www.misterwootube.com

From playlist The Normal Distribution

Video thumbnail

L08.9 Calculation of Normal Probabilities

MIT RES.6-012 Introduction to Probability, Spring 2018 View the complete course: https://ocw.mit.edu/RES-6-012S18 Instructor: John Tsitsiklis License: Creative Commons BY-NC-SA More information at https://ocw.mit.edu/terms More courses at https://ocw.mit.edu

From playlist MIT RES.6-012 Introduction to Probability, Spring 2018

Video thumbnail

Statistics 1 - (S1) - Standard Normal (10) - Rounding converted values

www.m4ths.com GCSE and A Level Worksheets, videos and helpbooks. Full course help for Foundation and Higher GCSE 9-1 Maths All content created by Steve Blades

From playlist S1- Statitistics - The Normal Distribution - Edexcel

Video thumbnail

Business Analytics Full Course

Business analytics (BA) is a set of disciplines and technologies for solving business problems using data analysis, statistical models and other quantitative methods. It involves an iterative, methodical exploration of an organization's data, with an emphasis on statistical analysis, to dr

From playlist Business Analytics

Video thumbnail

Chapter 6.2: Normal Distributions in General

Chapter 6.2 from "Introduction to Statistics, Think & Do" by Scott Stevens (http://www.StevensStats.com) Textbook from Publisher, $29.95 print, $9.95 PDF http://www.centerofmathematics.com/wwcomstore/index.php/thinkdov4-1.html Textbook from Amazon: https://amzn.to/2zJRCjL

From playlist Statistics Lecture Videos

Video thumbnail

Statistics Lecture 6.5: The Central Limit Theorem for Statistics. Using z-score, Standard Score

https://www.patreon.com/ProfessorLeonard Statistics Lecture 6.5: The Central Limit Theorem for Statistics. Using z-score, Standard Score

From playlist Statistics (Full Length Videos)

Video thumbnail

Chapter 7.5: A Summary and Some Loose Ends

Chapter 7.5 from "Introduction to Statistics, Think & Do" by Scott Stevens (http://www.StevensStats.com) Textbook from Publisher, $29.95 print, $9.95 PDF http://www.centerofmathematics.com/wwcomstore/index.php/thinkdov4-1.html Textbook from Amazon: https://amzn.to/2zJRCjL

From playlist Statistics Lecture Videos

Video thumbnail

OCR MEI Statistics 2 3.01 Introducing the Normal Distribution

Thanks for watching! Please like my new Facebook page https://www.facebook.com/TLMaths-1943955188961592/ to keep you updated with future videos :-)

From playlist [OLD SPEC] TEACHING OCR MEI STATISTICS 2 (S2)

Video thumbnail

Statistics 1 S1 Standard Normal 1) Basic Introduction

www.m4ths.com GCSE and A Level Worksheets, videos and helpbooks. Full course help for Foundation and Higher GCSE 9-1 Maths All content created by Steve Blades

From playlist S1- Statitistics - The Normal Distribution - Edexcel

Video thumbnail

Find Percentile with Mean and Standard Deviation (Normal Curves) | Statistics

We go over how to find percentiles with mean and standard deviation for a normal distribution, using a calculator (similar to TI-83) and a standard normal table. We discuss two problems, one where we are given a value and asked to calculate its percentile, and another where we are given a

From playlist Statistics

Video thumbnail

Order Graphs of a Normal Distribution by Standard Deviation

This video explains how to order graph from least to greatest based up the standard deviation.

From playlist The Normal Distribution

Video thumbnail

Central Limit Theorem - Sampling Distribution of Sample Means - Stats & Probability

This statistics video tutorial provides a basic introduction into the central limit theorem. It explains that a sampling distribution of sample means will form the shape of a normal distribution regardless of the shape of the population distribution if a large enough sample is taken from

From playlist Statistics

Related pages

Error function | 68–95–99.7 rule | Student's t-distribution | Standard deviation | Mean | Statistic | Mathematical table | Cumulative distribution function | Normal distribution | Probability