Moment (mathematics) | Articles containing proofs | Statistical deviation and dispersion
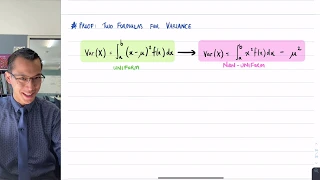
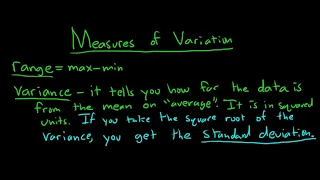
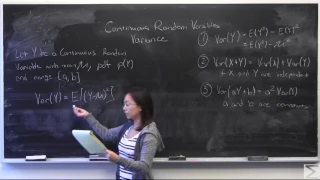
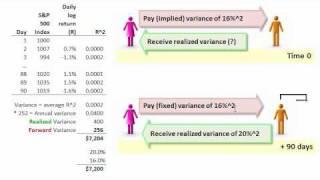
In probability theory and statistics, variance is the expectation of the squared deviation of a random variable from its population mean or sample mean. Variance is a measure of dispersion, meaning it is a measure of how far a set of numbers is spread out from their average value. Variance has a central role in statistics, where some ideas that use it include descriptive statistics, statistical inference, hypothesis testing, goodness of fit, and Monte Carlo sampling. Variance is an important tool in the sciences, where statistical analysis of data is common. The variance is the square of the standard deviation, the second central moment of a distribution, and the covariance of the random variable with itself, and it is often represented by , , , , or . An advantage of variance as a measure of dispersion is that it is more amenable to algebraic manipulation than other measures of dispersion such as the expected absolute deviation; for example, the variance of a sum of uncorrelated random variables is equal to the sum of their variances. A disadvantage of the variance for practical applications is that, unlike the standard deviation, its units differ from the random variable, which is why the standard deviation is more commonly reported as a measure of dispersion once the calculation is finished. There are two distinct concepts that are both called "variance". One, as discussed above, is part of a theoretical probability distribution and is defined by an equation. The other variance is a characteristic of a set of observations. When variance is calculated from observations, those observations are typically measured from a real world system. If all possible observations of the system are present then the calculated variance is called the population variance. Normally, however, only a subset is available, and the variance calculated from this is called the sample variance. The variance calculated from a sample is considered an estimate of the full population variance. There are multiple ways to calculate an estimate of the population variance, as discussed in the section below. The two kinds of variance are closely related. To see how, consider that a theoretical probability distribution can be used as a generator of hypothetical observations. If an infinite number of observations are generated using a distribution, then the sample variance calculated from that infinite set will match the value calculated using the distribution's equation for variance. (Wikipedia).
Variance (4 of 4: Proof of two formulas)
More resources available at www.misterwootube.com
From playlist Random Variables
Covariance (1 of 17) What is Covariance? in Relation to Variance and Correlation
Visit http://ilectureonline.com for more math and science lectures! To donate:a http://www.ilectureonline.com/donate https://www.patreon.com/user?u=3236071 We will learn the difference between the variance and the covariance. A variance (s^2) is a measure of how spread out the numbers of
From playlist COVARIANCE AND VARIANCE
More Standard Deviation and Variance
Further explanations and examples of standard deviation and variance
From playlist Unit 1: Descriptive Statistics
How to find the variance and standard deviation from a set of data
👉 Learn how to find the variance and standard deviation of a set of data. The variance of a set of data is a measure of spread/variation which measures how far a set of numbers is spread out from their average value. The standard deviation of a set of data is a measure of spread/variation
From playlist Variance and Standard Deviation
How to find the number of standard deviations that it takes to represent all the data
👉 Learn how to find the variance and standard deviation of a set of data. The variance of a set of data is a measure of spread/variation which measures how far a set of numbers is spread out from their average value. The standard deviation of a set of data is a measure of spread/variation
From playlist Variance and Standard Deviation
Learning how to find the variance and standard deviation from a set of data
👉 Learn how to find the variance and standard deviation of a set of data. The variance of a set of data is a measure of spread/variation which measures how far a set of numbers is spread out from their average value. The standard deviation of a set of data is a measure of spread/variation
From playlist Variance and Standard Deviation
Derivations.2.Derivation of Variance
This video is brought to you by the Quantitative Analysis Institute at Wellesley College. The material is best viewed as part of the online resources that organize the content and include questions for checking understanding: https://www.wellesley.edu/qai/onlineresources
From playlist Optional - Derivations
Please Subscribe here, thank you!!! https://goo.gl/JQ8Nys Measures of Variation
From playlist Statistics
Variance of Continuous Random Variables
In this video, Kelsey proves some properties of variance for continuous random variables.
From playlist Basics: Probability and Statistics
What are Variance Swaps? Financial Derivatives - Trading Volatility
In todays video we learn about variance swaps These classes are all based on the book Trading and Pricing Financial Derivatives, available on Amazon at this link. https://amzn.to/2WIoAL0 Check out our website http://www.onfinance.org/ Follow Patrick on twitter here: https://twitter.com
From playlist Volatility and Variance Swaps
Foundations of ANOVA – Variance Between and Within (12-2)
When measuring groups with ANOVA, there are two sources of variance: between and within. Variance between groups is due to actual treatment effect plus differences due to chance (or error). True variance between indicates differences between groups. Variance within the groups is due only t
From playlist WK12 One-Way ANOVA - Online Statistics for the Flipped Classroom
A variance swap can be used to hedge tail risk. One counterparty (Sally the trader, in this example) pays a forward (fixed) variance in exchange for a future, REALIZED variance. So she is "long volatility" and will profit if the realized variance is greater than expected. The advantage of
From playlist Derivatives: Exotic Options
Transformation and Weighting to correct model inadequacies (Part A)
Regression Analysis by Dr. Soumen Maity,Department of Mathematics,IIT Kharagpur.For more details on NPTEL visit http://nptel.ac.in
From playlist IIT Kharagpur: Regression Analysis | CosmoLearning.org Mathematics
Lect.8B: Estimating A Variance And The Chi-Square Distribution
Lecture with Per B. Brockhoff. Chapters: 00:00 - Introduction; 01:15 - Motivating Example; 03:45 - Variacne Estimates; 06:00 - The Sampling Distribution Of The Variance;
From playlist DTU: Introduction to Statistics | CosmoLearning.org
9 1 Static hedging with futures Part 1
BEM1105x Course Playlist - https://www.youtube.com/playlist?list=PL8_xPU5epJdfCxbRzxuchTfgOH1I2Ibht Produced in association with Caltech Academic Media Technologies. ©2020 California Institute of Technology
From playlist BEM1105x Course - Prof. Jakša Cvitanić
Bias-Variance In Machine Learning | Bias Variance Trade Off | Machine Learning Training | Edureka
** Machine Learning Certification Training: https://www.edureka.co/machine-learning-certification-training ** This Edureka video on 'Bias Variance In Machine Learning' covers the concept of bias and variance in a machine learning model and how it affects the performance of the model. Foll
From playlist Machine Learning Algorithms in Python (With Demo) | Edureka
21c Spatial Data Analytics: Scaling Statistics
Subsurface modeling course lecture on scaling statistics.
From playlist Spatial Data Analytics and Modeling
Variance of differences of random variables | Probability and Statistics | Khan Academy
Variance of Differences of Random Variables Watch the next lesson: https://www.khanacademy.org/math/probability/statistics-inferential/hypothesis-testing-two-samples/v/difference-of-sample-means-distribution?utm_source=YT&utm_medium=Desc&utm_campaign=ProbabilityandStatistics Missed the p
From playlist Random variables | AP Statistics | Khan Academy
(PP 4.5) Mean, variance, and moments
Definitions of mean, variance, and moments. A playlist of the Probability Primer series is available here: http://www.youtube.com/view_play_list?p=17567A1A3F5DB5E4
From playlist Probability Theory
MIT 6.041 Probabilistic Systems Analysis and Applied Probability, Fall 2010 View the complete course: http://ocw.mit.edu/6-041F10 Instructor: John Tsitsiklis License: Creative Commons BY-NC-SA More information at http://ocw.mit.edu/terms More courses at http://ocw.mit.edu
From playlist MIT 6.041SC Probabilistic Systems Analysis and Applied Probability, Fall 2013