Parametric statistics | Statistical tests

Student's t-test

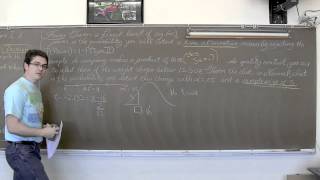
A t-test is any statistical hypothesis test in which the test statistic follows a Student's t-distribution under the null hypothesis. It is most commonly applied when the test statistic would follow a normal distribution if the value of a scaling term in the test statistic were known (typically, the scaling term is unknown and therefore a nuisance parameter). When the scaling term is estimated based on the data, the test statistic—under certain conditions—follows a Student's t distribution. The t-test's most common application is to test whether the means of two populations are different. (Wikipedia).

Student's t-test
Video thumbnail

Power of a T Test 1 Sample Mean

I explain the differences of finding Power of a t-Test compared to Power of a z-Test. Find free review test, useful notes and more at http://www.mathplane.com If you'd like to make a donation to support my efforts look for the "Tip the Teacher" button on my channel's homepage www.YouTube.c

From playlist AP Statistics

Video thumbnail

T Test Introduction

What is a t-test? Brief overview of the t value and test, using Excel for the calculations.

From playlist t-test

Video thumbnail

A Gentle Introduction to the One Sample t Test (10-2)

A one-sample t test will allow us to compare a sample mean to a population mean to determine if they are statistically significantly different. This video will introduce you to the fundamentals of the one-sample t test and prepare you for conducting one either by hand or using SPSS. This

From playlist WK10 One Sample t Tests - Online Statistics for the Flipped Classroom

Video thumbnail

How to Compare Two Samples Using t Tests (11-1)

The most basic and most popular inferential statistic – especially for beginning statistics students – is the t test. The t test is wonderful because it allows us to compare two samples. This opens up a world of possibility for our research. Researchers often want to compare two (or more)

From playlist WK11 Independent Sample t Tests and Paired t Tests - Online Statistics for the Flipped Classroom

Video thumbnail

T-Score vs Z-Score

When to choose a t-score or z-score with an easy to follow flowchart. Differences between the t-score and z-score. Check out my Statistics Handbook: https://www.statisticshowto.com/the-practically-cheating-statistics-handbook/ Thanks for your support!

From playlist Hypothesis Tests and Critical Values

Video thumbnail

Learning the One Sample t Test by Hand with Excel (10-3)

To really understand the fundamentals of statistics, it is helpful to calculate a one-sample t test by hand using formulas. To make the calculations easier, we use Excel for the math. We will use the five steps of hypothesis testing and Student's t table, to learn the test. This example us

From playlist WK10 One Sample t Tests - Online Statistics for the Flipped Classroom

Video thumbnail

T-Distribution Intro

What is a t distribution? Overview of the t test, t score formula, and the t-table. Also, when to use a z score vs. t score.

From playlist Probability Distributions

Video thumbnail

How to do a two sample t test paired two sample for means in Excel

How to do a two sample t test paired two sample for means in Excel using Data Analysis. If you aren't familiar with the t-test, check out my t-test playlist: https://www.youtube.com/playlist?list=PL0bQeSq_j3JMU-iWHxd4yQ-l2BPvqcRfV

From playlist t-test

Video thumbnail

Excel for Statistics 8c--Independent-samples t-tests

This video explains how to conduct independent-samples t-tests in Excel.

From playlist RStats Videos

Video thumbnail

Jamovi 1.2/1.6 Tutorial: One-sample t-test (Episode 7)

In this Jamovi tutorial, I go through a full example from the data library on one-sample t-tests. Features include both Student's t and Wilcoxon rank test, testing a direct hypothesis, and getting additional stats like effect size and descriptives. A simple interface for a simple test! Ja

From playlist Jamovi Tutorials

Video thumbnail

Paired Samples t Test in JASP with Excel dataset – QBA Business Statistics

Using an Excel data, we export a CSV to open in JASP, do a Paired Samples t Test, and interpret the results. These techniques illustrate all the potential challenges you might encounter as you work on data for the weekly quiz and the unit test. Music: Cold Funk - Funkorama by Kevin Ma

From playlist Business Statistics Lectures (FA2020, QBA337 @ MSU)

Video thumbnail

How do I... DO A PAIRED-SAMPLES T-TEST in Jamovi? (2022)

I have two measurements from the same person — how do I see if they differ on some other variable? I have these answers and more in this next episode of learning stats with Jamovi! Jamovi stats: https://www.jamovi.org/ NOTE: My tutorials always use the latest build release from Jamovi. S

From playlist Jamovi 2022 Tutorials

Video thumbnail

Independent Samples t Test in JASP with Excel dataset – QBA Business Statistics

Beginning with wrongly-formatted Excel data, we clean and structure the data, import to JASP, do an Independent Samples t Test, and interpret the results. These techniques illustrate all the potential challenges you might encounter as you work on data for the weekly quiz and the unit test.

From playlist Business Statistics Lectures (FA2020, QBA337 @ MSU)

Video thumbnail

99% of students make this Math ERROR - Never do this!

How to simplify a rational expression and fraction without making an error. For more in-depth math help check out my catalog of courses. Every course includes over 275 videos of easy to follow and understand math instruction, with fully explained practice problems and printable worksheets

From playlist GED Prep Videos

Video thumbnail

Guinness, Student, and the History of t Tests (10-1)

We concluded our lesson on z tests with the sad realization that z tests rarely get used in the real world. Instead of using a z test we compare samples to populations using a t test. William Sealy Gosset, a master brewer and a scientist at the Guinness brewery in Dublin, Ireland solved th

From playlist WK10 One Sample t Tests - Online Statistics for the Flipped Classroom

Video thumbnail

How do I... DO A ONE-SAMPLE T-TEST in Jamovi? (2022)

I have a population mean but not a population standard deviation -- how do I know if my sample is the same or different from my population? Instead of a z-test, we have to do a t-test! Wait, how do we do that? I have these answers and more in this next episode of learning stats with Jamovi

From playlist Jamovi 2022 Tutorials

Video thumbnail

Test of sample mean (Confidence interval, test statistic and p-value, FRM T2-10)

[Here is my XLS http://trtl.bz/010818-sample-mean-test] The explores the answer to Miller's EOC Question #2: "You are given the following sample of annual returns for a portfolio manager. If you believe that the distribution of returns has been stable over time and will continue to be stab

From playlist Quantitative Analysis (FRM Topic 2)

Video thumbnail

05 One-Sample t-Tests in SPSS – SPSS for Beginners

2021 NEW SERIES for SPSS 27: https://youtu.be/PN-H8GikRQ0 When we calculate the mean of a sample, we can then use a one-sample t test to compare that sample mean to another mean, such as a mean from a population, a normative group, or another known value (mean). The “one sample” t test is

From playlist Introduction to SPSS Statistics 27

Video thumbnail

Excel for Statistics 8a--t-tests, introduction and one-sample

This video explains how t-tests work, and shows how to perform a one-sample t-test in Excel

From playlist RStats Videos

Related pages

SPSS | Welch–Satterthwaite equation | Šidák correction for t-test | Mann–Whitney U test | Slutsky's theorem | Wilcoxon signed-rank test | MATLAB | P-value | Skewness | Nuisance parameter | Paired difference test | Exact test | Statistics | Analysis of variance | Chi-squared distribution | Noncentral t-distribution | Sample mean | Behrens–Fisher problem | Law of large numbers | Stata | Null hypothesis | Outlier | Independence (probability theory) | Central limit theorem | Location test | Observational study | Conditional change model | Levene's test | DAP (software) | F-test | Student's t-distribution | Q–Q plot | Brown–Forsythe test | Scale parameter | Blocking (statistics) | Gretl | Variance | Julia (programming language) | Welch's t-test | Posterior probability | Simple linear regression | Pearson correlation coefficient | QtiPlot | R (programming language) | Bartlett's test | Z-test | Normal distribution | Standard deviation | Statistical hypothesis testing | Arithmetic mean | PSPP | Hotelling's t-squared statistic | Degrees of freedom (statistics) | Type I and type II errors | Expected value | Test statistic | Location testing for Gaussian scale mixture distributions | Statistical significance | SAS (software) | F-test of equality of variances | Pearson distribution