
Overview of the F-Test. What it is and how it works with general steps and assumptions.
From playlist F Test

Quick example of how to find an f-value and look at an f-table for a two tailed F test.
From playlist F Test

How to run a two sample f test in Excel 2013
For more on hypothesis testing, visit: http://www.statisticshowto.com/post-index/critical-values-z-tables-hypothesis-testing/
From playlist F Test
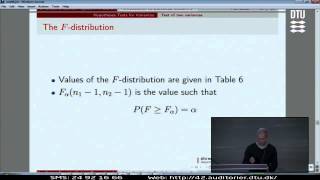
Lect.8F: Hypothesis Test For Two Variances, The F-Distribution The F-distribution
The F-distribution. Lecture with Per B. Brockhoff. Chapters: 00:00 - The Sampling Distribution For Comparison Of Two Variances; 03:30 - The F-Distribution;
From playlist DTU: Introduction to Statistics | CosmoLearning.org
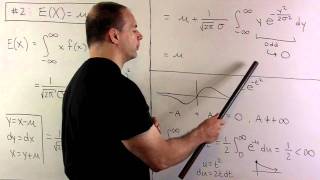
Mean and Variance of Normal Distribution
Calculus/Probability: We calculate the mean and variance for normal distributions. We also verify the probability density function property using the assumption that the improper integral of exp(-x^2) over the real line equals sqrt(pi).
From playlist Probability
Levene’s Test of Homogeneity of Variance in SPSS (11-3)
One important assumption about the Independent-Samples t Test is that the variances in the sample groups are approximately equal. We assume that the samples have “homogeneity of variance.” Levene’s Test for Equality of Variances is a test of whether the variances of the two samples/groups
From playlist WK11 Independent Sample t Tests and Paired t Tests - Online Statistics for the Flipped Classroom

How to find the variance and standard deviation from a set of data
👉 Learn how to find the variance and standard deviation of a set of data. The variance of a set of data is a measure of spread/variation which measures how far a set of numbers is spread out from their average value. The standard deviation of a set of data is a measure of spread/variation
From playlist Variance and Standard Deviation

How to find the number of standard deviations that it takes to represent all the data
👉 Learn how to find the variance and standard deviation of a set of data. The variance of a set of data is a measure of spread/variation which measures how far a set of numbers is spread out from their average value. The standard deviation of a set of data is a measure of spread/variation
From playlist Variance and Standard Deviation

Chapter 11.3: ANOVA - An Introduction
Chapter 11.3 from "Introduction to Statistics, Think & Do" by Scott Stevens (http://www.StevensStats.com) Textbook from Publisher, $29.95 print, $9.95 PDF http://www.centerofmathematics.com/wwcomstore/index.php/thinkdov4-1.html Textbook from Amazon: https://amzn.to/2zJRCjL
From playlist Statistics Lecture Videos

07b Data Analytics: Hypothesis Testing
Lecture on hypothesis testing.
From playlist Data Analytics and Geostatistics
Review of Block B, weeks 5 - 8, for QBA 337.
From playlist Business Statistics Lectures (FA2020, QBA337 @ MSU)
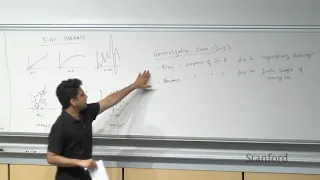
Stanford CS229: Machine Learning | Summer 2019 | Lecture 12 - Bias and Variance & Regularization
For more information about Stanford’s Artificial Intelligence professional and graduate programs, visit: https://stanford.io/3notMzh Anand Avati Computer Science, PhD To follow along with the course schedule and syllabus, visit: http://cs229.stanford.edu/syllabus-summer2019.html
From playlist Stanford CS229: Machine Learning Course | Summer 2019 (Anand Avati)

Sums of Squares.10.ExtraF-Test
This video is brought to you by the Quantitative Analysis Institute (QAI) at Wellesley College as part of its Blended Learning Initiative. More information on the QAI's online resources can be found here: www.wellesley.edu/qai/onlineresources. To see more videos on applied statistics, chec
From playlist Applied Data Analysis and Statistical Inference

Analyze Phase In Six Sigma | Six Sigma Green Belt Training
The fourth lesson of the Lean Six Sigma Green Belt Course offered by Simplilearn. This lesson will cover the details of the analyze phase. In the Lean Six Sigma process, you begin with the define phase where you define the problem and then the current process performance is measured. Next
From playlist Six Sigma Training Videos [2022 Updated]

One Way ANOVA in Business Statistics, How and Why we Need ANOVA
The One-Way ANOVA allows us to extend the independent samples t-test for use with three or more groups. Instead of comparing means (like a t test), we analyze the variance between and within the groups. If the ANOVA is significant, we then follow up with a post hoc test to determine what d
From playlist Business Statistics Lectures (FA2020, QBA337 @ MSU)

Learning how to find the variance and standard deviation from a set of data
👉 Learn how to find the variance and standard deviation of a set of data. The variance of a set of data is a measure of spread/variation which measures how far a set of numbers is spread out from their average value. The standard deviation of a set of data is a measure of spread/variation
From playlist Variance and Standard Deviation

11. Parametric Hypothesis Testing (cont.) and Testing Goodness of Fit
MIT 18.650 Statistics for Applications, Fall 2016 View the complete course: http://ocw.mit.edu/18-650F16 Instructor: Philippe Rigollet In this lecture, Prof. Rigollet talked about Glivenko-Cantelli Theorem (fundamental theorem of statistics), Donsker’s Theorem, and Kolmogorov-Smirnov test
From playlist MIT 18.650 Statistics for Applications, Fall 2016

How To Calculate and Understand Analysis of Variance (ANOVA) F Test.
Visual tutorial on how to calculate analysis of variance (ANOVA) and how to understand it too. The tutorial includes how to interpret the results of an Anova test, f test and how to look up values in the f distribution table. The Anova example is for a one way anova test. I am rounding in
From playlist How to Calculate Analysis of Variance (ANOVA), f test, by hand, using Excel, using SPSS