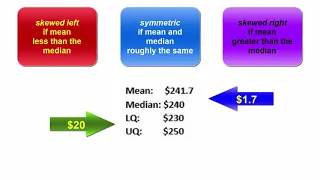
Mean v Median and the implications
Differences between the mean and median suggest the presence of outliers and/or the possible shape of a distribution
From playlist Unit 1: Descriptive Statistics

More Standard Deviation and Variance
Further explanations and examples of standard deviation and variance
From playlist Unit 1: Descriptive Statistics

What is elementary statistics?
Taking an elementary statistics class soon? This short video gives you an overview of what to expect.
From playlist Basic Statistics (Descriptive Statistics)
Descriptive Statistics vs Inferential Statistics
This video tutorial provides an introduction into descriptive statistics and inferential statistics. My Website: https://www.video-tutor.net Patreon Donations: https://www.patreon.com/MathScienceTutor Amazon Store: https://www.amazon.com/shop/theorganicchemistrytutor Subscribe: https:
From playlist Statistics
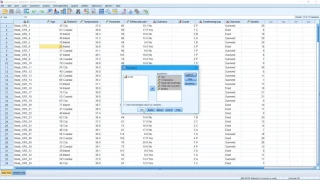
In this video I show you how to do simple descriptive statistics, including calculating the average and standard deviation of variables.
From playlist Healthcare statistics with SPSS
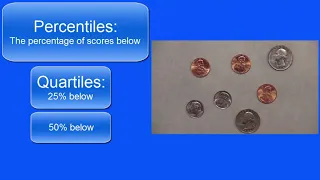
Percentiles, Deciles, Quartiles
Understanding percentiles, quartiles, and deciles through definitions and examples
From playlist Unit 1: Descriptive Statistics

Descriptive Statistics Lecture
Lecturer: Michael Mizer Recorded: Fall 2015 Learn more about descriptive statistics! Learn more and find our documents on our OSF page: https://osf.io/e3d9w/. Look at our basic statistics page for complete lecture series: https://statisticsofdoom.com/page/basic-statistics/
From playlist Basic Statistics Videos
What are "moments" in statistics? An intuitive video!
See the whole descriptive statistics playlist here: https://www.youtube.com/watch?v=bfQLNyiDPsk&list=PLTNMv857s9WVStKLco6ZBOsfSGXzJ1L0f See all my videos at http://www.zstatistics.com/videos/ 0:00 Introduction 1:23 Intuition behind moments 9:23 Higher order moments 12:10 Sampling adjustm
From playlist Descriptive Statistics (13 videos)

This video explains how to determine mean, median and mode. It also provided examples. http://mathispower4u.yolasite.com/
From playlist Statistics: Describing Data
Descriptive Statistics for Scale Data in SPSS 27 - Statistics with SPSS for Beginners (5 of 8)
Dr. Daniel and Diva explain scale variables and show you how to display them in tables, as numbers, and with graphs. You learn a shortcut to display descriptive statistics quickly, then how to display descriptive statistics using the FREQUENCIES command. We will recode a scale variable i
From playlist Introduction to Statistics with IBM SPSS 27 for Beginners (with Puppies)
Quantitative Analysis For Management | Quantitative Analysis Explained For Beginners | Simplilearn
This video on Quantitative Analysis for Management will acquaint you with all the essential details that you should know about quantitative business analysis. In this Quantitative Analysis Explained For Beginners tutorial, you will understand what quantitative analysis is. You'll also lear
From playlist Ful Stack Web Development 🔥[2023 Updated]
Speaking of Statistics – DEFINING the Field of Statistics (1-3)
The term “statistics” may refer to the practice, procedure, or products of statistics. The Practice of Statistics means the field of statistics: “The art and science of making sense of data”. The Procedures of Statistics reefer to mathematical techniques to organize, summarize, and interpr
From playlist From Numbers to Variables to Data in Statistics (WK 1 - QBA 237)
Descriptive Statistics for BINNED Continuous Data in JASP (WK3g)
Link to Describing Data WK3: https://researchbydesign.notion.site/MS-Excel-acae45d8d8ed43b5b8d6dd9fe25cad9a#6ee2d378b57e4b6ba08d92166d9a88f9 Dr. Daniel shows you how to explore a scale variable that has been converted to bins. JASP wants to treat scale variables as continuous, which is th
From playlist Describing Data with Descriptive Statistics (WK 3 - QBA 237)

DESCRIPTIVE Statistics: Describing Data for Statistics (3-1)
Descriptive Statistics are statistical techniques used to summarize the characteristics of the data; they help us prepare the raw scores for serving up to the public. We can “serve up” (i.e., display) the data, with numbers, called numerical summaries or pictures, called graphical displays
From playlist Describing Data with Descriptive Statistics (WK 3 - QBA 237)

03 Descriptive Statistics and z Scores in SPSS – SPSS for Beginners
2021 NEW SERIES for SPSS 27: https://youtu.be/PN-H8GikRQ0 In this third video about SPSS for Beginners, Dr. Daniel shows you three ways to approach descriptive statistics in SPSS. If you want quick and basic descriptive statistics, use the Descriptives command to get the most commonly used
From playlist Introduction to SPSS Statistics 27

Learn how to calculate basic descriptive statistics such as mean and standard deviation using Minitab 17.
From playlist Minitab 17 Instructional Videos

Statistics For Data Science | Descriptive & Inferential Statistics | Data Science Training | Edureka
🔥 𝐄𝐝𝐮𝐫𝐞𝐤𝐚 𝐒𝐭𝐚𝐭𝐢𝐬𝐭𝐢𝐜𝐬 𝐃𝐚𝐭𝐚 𝐒𝐜𝐢𝐞𝐧𝐜𝐞 𝐂𝐞𝐫𝐭𝐢𝐟𝐢𝐜𝐚𝐭𝐢𝐨𝐧 𝐂𝐨𝐮𝐫𝐬𝐞 (Use code: "𝐘𝐎𝐔𝐓𝐔𝐁𝐄𝟐𝟎"): https://www.edureka.co/data-science-certification-courses This Edureka "Statistics For Data Science" video will introduce you to the concepts of statistics using Data Science. You will learn about Descriptive
From playlist Data Science Training Videos
Descriptive Statistics for Categorical Data - Statistics with SPSS 27 for Beginners (4 of 8)
Dr. Daniel, Diva, and Desi explain categorical variables and show you how to display them in tables, as numbers, and with graphs. You learn the correct choices for describing categorical data using the Dog Toys dataset and the FREQUENCIES menu in SPSS. We create frequency tables and bar c
From playlist Introduction to Statistics with IBM SPSS 27 for Beginners (with Puppies)

Cumulative Frequency (1 of 2: Basic calculations)
More resources available at www.misterwootube.com
From playlist Descriptive Statistics & Bivariate Data Analysis

Two ways to find descriptive statistics in SPSS, like the mean, max and min as well as percentiles, histograms and bar charts.
From playlist SPSS