Curve fitting | Estimation theory | Actuarial science | Regression analysis
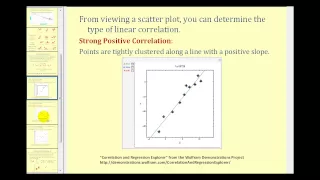
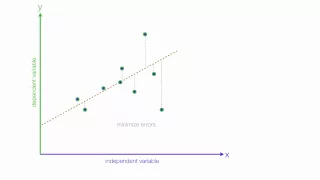
In statistical modeling, regression analysis is a set of statistical processes for estimating the relationships between a dependent variable (often called the 'outcome' or 'response' variable, or a 'label' in machine learning parlance) and one or more independent variables (often called 'predictors', 'covariates', 'explanatory variables' or 'features'). The most common form of regression analysis is linear regression, in which one finds the line (or a more complex linear combination) that most closely fits the data according to a specific mathematical criterion. For example, the method of ordinary least squares computes the unique line (or hyperplane) that minimizes the sum of squared differences between the true data and that line (or hyperplane). For specific mathematical reasons (see linear regression), this allows the researcher to estimate the conditional expectation (or population average value) of the dependent variable when the independent variables take on a given set of values. Less common forms of regression use slightly different procedures to estimate alternative location parameters (e.g., quantile regression or Necessary Condition Analysis) or estimate the conditional expectation across a broader collection of non-linear models (e.g., nonparametric regression). Regression analysis is primarily used for two conceptually distinct purposes. First, regression analysis is widely used for prediction and forecasting, where its use has substantial overlap with the field of machine learning. Second, in some situations regression analysis can be used to infer causal relationships between the independent and dependent variables. Importantly, regressions by themselves only reveal relationships between a dependent variable and a collection of independent variables in a fixed dataset. To use regressions for prediction or to infer causal relationships, respectively, a researcher must carefully justify why existing relationships have predictive power for a new context or why a relationship between two variables has a causal interpretation. The latter is especially important when researchers hope to estimate causal relationships using observational data. (Wikipedia).
What is a Regression Equation?
Link to next video: https://youtu.be/p_fu7gIikxY
From playlist Regression Analysis
Introduction to Regression Analysis
This video introduced analysis and discusses how to determine if a given regression equation is a good model using r and r^2.
From playlist Performing Linear Regression and Correlation
Overview of regression analysis, linear and multiple regression, and the coefficient of determination.
From playlist Regression Analysis
An introduction to Regression Analysis
Regression Analysis, R squared, statistics class, GCSE Like us on: http://www.facebook.com/PartyMoreStudyLess Related Videos Playlist on Linear Regression http://www.youtube.com/playlist?list=PLF596A4043DBEAE9C Using SPSS for Multiple Linear Regression http://www.youtube.com/playlist?li
From playlist Linear Regression.
Linear regression is used to compare sets or pairs of numerical data points. We use it to find a correlation between variables.
From playlist Learning medical statistics with python and Jupyter notebooks
An Introduction to Linear Regression Analysis
Tutorial introducing the idea of linear regression analysis and the least square method. Typically used in a statistics class. Playlist on Linear Regression http://www.youtube.com/course?list=ECF596A4043DBEAE9C Like us on: http://www.facebook.com/PartyMoreStudyLess Created by David Lon
From playlist Linear Regression.
Brief intro the the linear regression formula and errors.
From playlist Regression Analysis
What are Residuals in Regression?
Brief intro to residuals in regression. What they are and what they look like in relation to a line of best fit. Sum and mean of residuals.
From playlist Regression Analysis
Regression Analysis | What Is Regression Analysis | Introduction to Regression Analysis |Simplilearn
In this video we are going to cover how regression analysis perform by SVM algorithm using Olympic 2022 dataset. This video will help you to understand what is machine learning, what is supervised learning, types of supervised learning - Classification and Regression, What is regression a
Regression In Excel | Excel Regression Analysis Explained | Excel Tutorial | Simplilearn
🔥 Data Analyst Master's Program (Discount Code: YTBE15): https://www.simplilearn.com/data-analyst-masters-certification-training-course?utm_campaign=RegressioninExcel-0wr9ojMxkuQ&utm_medium=DescriptionFF&utm_source=youtube 🔥 Professional Certificate Program In Data Analytics: https://www.s
From playlist Business Analyst Training Videos
Predictive Modelling Techniques | Data Science With R Tutorial
🔥 Advanced Certificate Program In Data Science: https://www.simplilearn.com/pgp-data-science-certification-bootcamp-program?utm_campaign=PredictiveModeling-0gf5iLTbiQM&utm_medium=Descriptionff&utm_source=youtube 🔥 Data Science Bootcamp (US Only): https://www.simplilearn.com/data-science-bo
From playlist R Programming For Beginners [2022 Updated]
Data Science - Part XV - MARS, Logistic Regression, & Survival Analysis
For downloadable versions of these lectures, please go to the following link: http://www.slideshare.net/DerekKane/presentations https://github.com/DerekKane/YouTube-Tutorials This lecture provides an overview on extending the regression concepts brought forth in previous lectures. We wi
From playlist Data Science
Data Science - Part IV - Regression Analysis and ANOVA Concepts
For downloadable versions of these lectures, please go to the following link: http://www.slideshare.net/DerekKane/presentations https://github.com/DerekKane/YouTube-Tutorials This lecture provides an overview of linear regression analysis, interaction terms, ANOVA, optimization, log-leve
From playlist Data Science
Stock Market Prediction : Python for Finance 5
In this video I'll show you how to make Stock Market Predictions using Regression Analysis. Regression Analysis can be used to guide you towards stocks that are expected to provide, or not provide a high ROI based off of past performance. Additional analysis can then be done to make invest
From playlist Python for Finance
How to Select the Correct Predictive Modeling Technique | Machine Learning Training | Edureka
🔥Edureka Machine Learning Certification Training: https://www.edureka.co/machine-learning-certification-training This Edureka video on 'Selecting The Correct Predictive Modeling Technique' covers the various deciding factors to choose the correct predictive modeling technique. Following ar
From playlist Machine Learning Tutorial in Python | Edureka
Excel Regression Analysis Output Explained
Overview of the Excel regression analysis output.
From playlist Regression Analysis
Introduction to Least Squares Regression Method Using Python | Machine Learning Algorithm | Edureka
🔥 Post Graduate Diploma in Artificial Intelligence by E&ICT Academy NIT Warangal: https://www.edureka.co/executive-programs/machine-learning-and-ai This Edureka session on Least Squares Regression Method will help you understand the math behind Regression Analysis and how it can be impleme
From playlist Python Programming Tutorials | Edureka
Simple Linear Regression(Part A)
Regression Analysis by Dr. Soumen Maity,Department of Mathematics,IIT Kharagpur.For more details on NPTEL visit http://nptel.ac.in
From playlist IIT Kharagpur: Regression Analysis | CosmoLearning.org Mathematics
From playlist STAT 501