Curve fitting | Numerical analysis | Regression analysis | Interpolation
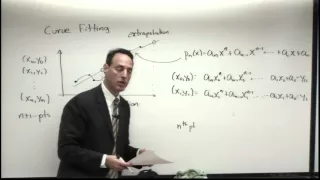
Curve fitting

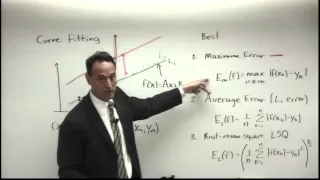
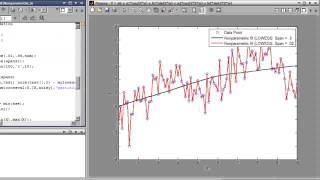
Curve fitting is the process of constructing a curve, or mathematical function, that has the best fit to a series of data points, possibly subject to constraints. Curve fitting can involve either interpolation, where an exact fit to the data is required, or smoothing, in which a "smooth" function is constructed that approximately fits the data. A related topic is regression analysis, which focuses more on questions of statistical inference such as how much uncertainty is present in a curve that is fit to data observed with random errors. Fitted curves can be used as an aid for data visualization, to infer values of a function where no data are available, and to summarize the relationships among two or more variables. Extrapolation refers to the use of a fitted curve beyond the range of the observed data, and is subject to a degree of uncertainty since it may reflect the method used to construct the curve as much as it reflects the observed data. For linear-algebraic analysis of data, "fitting" usually means trying to find the curve that minimizes the vertical (y-axis) displacement of a point from the curve (e.g., ordinary least squares). However, for graphical and image applications, geometric fitting seeks to provide the best visual fit; which usually means trying to minimize the orthogonal distance to the curve (e.g., total least squares), or to otherwise include both axes of displacement of a point from the curve. Geometric fits are not popular because they usually require non-linear and/or iterative calculations, although they have the advantage of a more aesthetic and geometrically accurate result. (Wikipedia).

Curve fitting
Video thumbnail

What is Curve Fitting Toolbox? - Curve Fitting Toolbox Overview

Get a Free Trial: https://goo.gl/C2Y9A5 Get Pricing Info: https://goo.gl/kDvGHt Ready to Buy: https://goo.gl/vsIeA5 Fit curves and surfaces to data using regression, interpolation, and smoothing using Curve Fitting Toolbox. For more videos, visit http://www.mathworks.com/products/curvefi

From playlist Math, Statistics, and Optimization

Video thumbnail

How to Perform Curve Fitting Using the Curve Fitting App in MATLAB

Learn how to perform curve fitting in MATLAB® using the Curve Fitting app, and fit noisy data using smoothing spline. This video shows you how to use the Curve Fitting app to interactively try a variety of fitting algorithms, assess the fit numerically, and generate code from the app. See

From playlist “How To” with MATLAB and Simulink

Video thumbnail

Lecture: Polynomial Fits and Splines

Polynomial fitting of the data, via Lagrange polynomials, can also be considered as the fit curves go through all data points. Spline technology is developed to circumvent polynomial wiggle.

From playlist Beginning Scientific Computing

Video thumbnail

Lecture: Least-Squares Fitting Methods

The basic theory of curve fitting and least-square error is developed.

From playlist Beginning Scientific Computing

Video thumbnail

Integration 11 Lengths of Plane Curves Part 1

Using Integration to determine the length of a curve.

From playlist Integration

Video thumbnail

Introduction to Surface Fitting

Get a Free Trial: https://goo.gl/C2Y9A5 Get Pricing Info: https://goo.gl/kDvGHt Ready to Buy: https://goo.gl/vsIeA5 Use regression, interpolation, and smoothing to fit surfaces to data. For more videos, visit http://www.mathworks.com/products/curvefitting/examples.html

From playlist Math, Statistics, and Optimization

Video thumbnail

Data Fitting: Basic Curve Fitting, Part 4

Data Science for Biologists Data Fitting: Basic Curve Fitting Part 4 Course Website: data4bio.com Instructors: Nathan Kutz: faculty.washington.edu/kutz Bing Brunton: faculty.washington.edu/bbrunton Steve Brunton: faculty.washington.edu/sbrunton

From playlist Data Science for Biologists

Video thumbnail

Line integral over 2 curves

Free ebook http://tinyurl.com/EngMathYT How to integrate over 2 curves. This example discusses the additivity property of line integrals (sometimes called path integrals).

From playlist Engineering Mathematics

Video thumbnail

Step testing

We apply nonlinear curve fitting and linear regression to the problem of identifying the parameters of a model from responses over time

From playlist Parameter estimation

Video thumbnail

Uncertainty propagation d: Sample variance curve fitting

(C) 2012 David Liao lookatphysics.com CC-BY-SA Replaces unscripted draft Reduced chi-square χ2 fitting Normalized residuals

From playlist Probability, statistics, and stochastic processes

Video thumbnail

gnuplot Tutorial 3: Curve Fitting, SSR and WSSR (unweighted and weighted)

The gnuplot part starts at 5:13 Datafiles used in the video: https://pastebin.com/raw/1bVATcj3 https://pastebin.com/raw/FRSehmDR In the third part of my tutorial series about gnuplot I talk about curve fitting, an important aspect of scientific work. First I show how curve fitting is equi

From playlist gnuplot Tutorial

Video thumbnail

Lowess and Loess, Clearly Explained!!!

If you can fit a line, you can fit a curve! I've even got example R code on the StatQuest GitHub: https://github.com/StatQuest/lowess_loess_demo/blob/master/lowess_loess_demo.R For a complete index of all the StatQuest videos, check out: https://statquest.org/video-index/ If you'd like t

From playlist StatQuest

Video thumbnail

Data Fitting: Matlab Implementation, Part 1

Data Science for Biologists Data Fitting: Matlab Implementation Part 1 Course Website: data4bio.com Instructors: Nathan Kutz: faculty.washington.edu/kutz Bing Brunton: faculty.washington.edu/bbrunton Steve Brunton: faculty.washington.edu/sbrunton

From playlist Data Science for Biologists

Video thumbnail

Neural Networks Pt. 1: Inside the Black Box

Neural Networks are one of the most popular Machine Learning algorithms, but they are also one of the most poorly understood. Everyone says Neural Networks are "black boxes", but that's not true at all. In this video I break each piece down and show how it works, step-by-step, using simple

From playlist StatQuest

Video thumbnail

Modelling Population Growth

We use the differential properties of the exponential and logistic curves to fit an equation to real world data. This is part of the professional development course https://www.openlearning.com/courses/populationgrowthandthelogisticcurve offered by the University of New South Wales.

From playlist Mathematics in The Modern World: PD courses for teachers

Video thumbnail

Nonparametric Fitting

Get a Free Trial: https://goo.gl/C2Y9A5 Get Pricing Info: https://goo.gl/kDvGHt Ready to Buy: https://goo.gl/vsIeA5 Develop a predictive model without specifying a function that describes the relationship between variables. For more videos, visit http://www.mathworks.com/products/curvefi

From playlist Math, Statistics, and Optimization

Video thumbnail

WTF is a Bézier Curve?

What is a Bézier curve? Programmers use them everyday for graphic design, animation timing, SVG, and more. #shorts #animation #programming Animated Bézier https://www.jasondavies.com/animated-bezier/

From playlist CS101

Related pages

Smoothing | Smoothing spline | Gnuplot | Multi expression programming | Runge's phenomenon | MATLAB | SciPy | Logistic function | Regression analysis | GNU Scientific Library | Inflection point | Angle | Osculating circle | Interpolation | Estimation theory | Least-squares adjustment | Polynomial | Function approximation | Curve | Curve-fitting compaction | GNU Octave | List of statistical software | Arc length | Range (statistics) | Least squares | Statistical inference | Spline interpolation | Sinusoidal model | Uncertainty | Calibration curve | Line fitting | Maple (software) | Sigmoid function | Goodness of fit | Function (mathematics) | Ordinary least squares | R (programming language) | Levenberg–Marquardt algorithm | Overfitting | Normal distribution | Nonlinear regression | Magnitude (mathematics) | Extrapolation | Total least squares | Trigonometric functions | Linear trend estimation | Cauchy distribution | Spline (mathematics) | Slope | Time series | Curvature | Scilab | Probability distribution fitting | Genetic programming | Plane curve