
Statistics: Ch 3 Bivariate Data (1 of 55) What is Bivariate Data?
Visit http://ilectureonline.com for more math and science lectures! We will learn what is bivariate data (or data consisting 2 variables, qualitative and/or quantitative). To donate: http://www.ilectureonline.com/donate https://www.patreon.com/user?u=3236071 . Next video in this series c
From playlist THE "WHAT IS" PLAYLIST

Correlation Coefficient (1 of 2: Overview)
More resources available at www.misterwootube.com
From playlist Bivariate Data Analysis

Introduction to Bivariate Data (1 of 2: Dependent & independent variables)
More resources available at www.misterwootube.com
From playlist Descriptive Statistics & Bivariate Data Analysis

Correlation Coefficient (2 of 2: Evaluating with a calculator)
More resources available at www.misterwootube.com
From playlist Bivariate Data Analysis

Statistics: Ch 3 Bivariate Data (10 of 25) Positive and Negative Correlation
Visit http://ilectureonline.com for more math and science lectures! We will learn the difference between positive and negative correlation. To donate: http://www.ilectureonline.com/donate https://www.patreon.com/user?u=3236071 . Next video in this series can be seen at: https://youtu.be/
From playlist STATISTICS CH 3 BIVARIATE DATA

Understanding bivariate and univariate data
From playlist Integrated Algebra Regents

More resources available at www.misterwootube.com
From playlist Bivariate Data Analysis
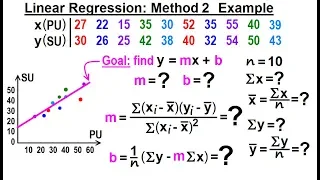
Statistics: Ch 3 Bivariate Data (23 of 25) Linear Regression: Method 2: Ex.
Visit http://ilectureonline.com for more math and science lectures! We will find the linear regression, best fit line, y=mx+b=? using 10-sets of push-ups and sit-up data. Method 2 To donate: http://www.ilectureonline.com/donate https://www.patreon.com/user?u=3236071 . Next video in this
From playlist STATISTICS CH 3 BIVARIATE DATA
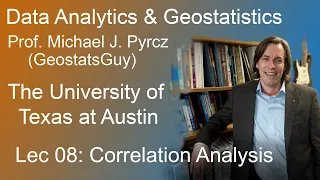
08 Data Analytics: Correlation
Lecture on bivariate statistics and correlation.
From playlist Data Analytics and Geostatistics

Four things to keep in mind about connectivity
This video lesson is part of a complete course on neuroscience time series analyses. The full course includes - over 47 hours of video instruction - lots and lots of MATLAB exercises and problem sets - access to a dedicated Q&A forum. You can find out more here: https://www.udemy.
From playlist NEW ANTS #4) Synchronization

Statistics: Ch 3 Bivariate Data (5 of 25) 2 Quantitative Data Sets: Ex.
Visit http://ilectureonline.com for more math and science lectures! We will graph a 2-quantitative data set of push-ups and sit-ups in a scatter diagram where push-ups is the independent variable and sit-ups are the dependent variable. To donate: http://www.ilectureonline.com/donate http
From playlist STATISTICS CH 3 BIVARIATE DATA

Bivariate relationship linearity, strength and direction | AP Statistics | Khan Academy
Describe a bivariate relationship's linearity, strength, and direction. View more lessons or practice this subject at http://www.khanacademy.org/math/ap-statistics/bivariate-data-ap/scatterplots-correlation/v/bivariate-relationship-linearity-strength-and-direction?utm_source=youtube&utm_m
From playlist Exploring bivariate numerical data | AP Statistics | Khan Academy

OCR MEI Statistics Minor A: PMCC: 08 Bivariate Normal Distribution
https://www.buymeacoffee.com/TLMaths Navigate all of my videos at https://sites.google.com/site/tlmaths314/ Like my Facebook Page: https://www.facebook.com/TLMaths-1943955188961592/ to keep updated Follow me on Instagram here: https://www.instagram.com/tlmaths/ Many, MANY thanks to Dea
From playlist OCR MEI Statistics Minor A: PMCC

From playlist STAT 200 Lectures (OER)
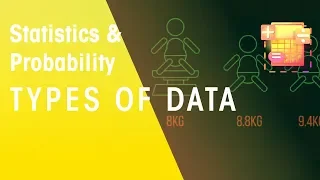
Types Of Data | Statistics & Probability | Maths | FuseSchool
CREDITS Animation & Design: Waldi Apollis Narration: Lucy Billings Script: Lucy Billings Hi, I’m Lucy and in this video, we are going to look at the different types of data that exist and how it can be classified. Starting with data collection... If data is collected by or for the compa
From playlist MATHS

Statistics: Ch 3 Bivariate Data (9 of 25) Dependent and Independent Variable
Visit http://ilectureonline.com for more math and science lectures! We will learn and how to tell the difference between dependent and independent variable. In this example case, we will use gambling time and money lost. To donate: http://www.ilectureonline.com/donate https://www.patreon
From playlist STATISTICS CH 3 BIVARIATE DATA

05c Machine Learning: Feature Selection
Lecture on methods for feature selection for machine learning workflows. Follow along with the demonstration workflows in Python: o. Feature Selection / Ranking: https://github.com/GeostatsGuy/PythonNumericalDemos/blob/master/SubsurfaceDataAnalytics_Feature_Ranking.ipynb Subsurface Mach
From playlist Machine Learning