Compound probability distributions | Special functions | Continuous distributions | Location-scale family probability distributions | Normal distribution | Probability distributions with non-finite variance | Infinitely divisible probability distributions

Student's t-distribution

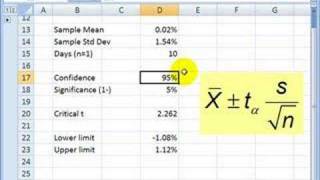
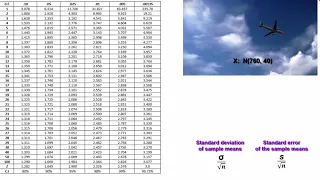
In probability and statistics, Student's t-distribution (or simply the t-distribution) is any member of a family of continuous probability distributions that arise when estimating the mean of a normally distributed population in situations where the sample size is small and the population's standard deviation is unknown. It was developed by English statistician William Sealy Gosset under the pseudonym "Student". The t-distribution plays a role in a number of widely used statistical analyses, including Student's t-test for assessing the statistical significance of the difference between two sample means, the construction of confidence intervals for the difference between two population means, and in linear regression analysis. Student's t-distribution also arises in the Bayesian analysis of data from a normal family. If we take a sample of observations from a normal distribution, then the t-distribution with degrees of freedom can be defined as the distribution of the location of the sample mean relative to the true mean, divided by the sample standard deviation, after multiplying by the standardizing term . In this way, the t-distribution can be used to construct a confidence interval for the true mean. The t-distribution is symmetric and bell-shaped, like the normal distribution. However, the t-distribution has heavier tails, meaning that it is more prone to producing values that fall far from its mean. This makes it useful for understanding the statistical behavior of certain types of ratios of random quantities, in which variation in the denominator is amplified and may produce outlying values when the denominator of the ratio falls close to zero. The Student's t-distribution is a special case of the generalized hyperbolic distribution. (Wikipedia).

Student's t-distribution
Video thumbnail

What is the t-distribution? An extensive guide!

See all my videos at http://www.zstatistics.com/videos/ 0:00 Introduction 2:17 Overview 6:06 Sampling RECAP 12:27 Visualising the t distribution 14:24 Calculating values from the t distribution (EXCEL and t-tables!)

From playlist Distributions (10 videos)

Video thumbnail

T-Distribution Intro

What is a t distribution? Overview of the t test, t score formula, and the t-table. Also, when to use a z score vs. t score.

From playlist Probability Distributions

Video thumbnail

Student's T Distribution - Confidence Intervals & Margin of Error

This statistics video tutorial provides a basic introduction into the student's t-distribution. It explains how to construct confidence intervals around a population mean using the student's t-distribution as well as calculating the margin of error or error bound of the mean. It's a good

From playlist Statistics

Video thumbnail

The Student's t-Distribution: Confidence Intervals

This lesson introduces the Student's t-distribution and shows how to determine a mean confidence interval. http://mathispower4u.com

From playlist Confidence Intervals

Video thumbnail

T Distribution on the TI 83

How to find a t critical value on the ti 83 AND how to find the area under a t distribution curve,

From playlist TI 83 for Statistics

Video thumbnail

FRM: Student's t distribution

The small sample is a 10-day series of Google's daily periodic returns. The question is, with 95% confidence, what is the true (population) average return? This is the essence of statistics, based on sample statistics (sample mean, sample variance) we are trying to infer population paramet

From playlist Statistics: Distributions

Video thumbnail

Intro to t Distributions for Mean Inference

Intro and overview of t distributions and how they relate to Z distributions for means. Confidence intervals for means and hypothesis tests for means are typically using t distributions.

From playlist Unit 9: t Inference and 2-Sample Inference

Video thumbnail

Hypothesis Testing - Difference of Two Means - Student's -Distribution & Normal Distribution

This statistics video explains how to perform hypothesis testing with two sample means using the t-test with the student's t-distribution and the z-test with the normal distribution table. My Website: https://www.video-tutor.net Patreon Donations: https://www.patreon.com/MathScienceTuto

From playlist Statistics

Video thumbnail

Level 1 Chartered Financial Analyst (CFA ®): Sampling and Estimation

In this video, I'm looking forward to sharing highlights with you from the CFA section, sampling and estimation. Sampling and estimation in statistics are theoretically essential and foundational, but in actual practice, it's very important. This is the practice of using samples to draw in

From playlist Level 1 Chartered Financial Analyst (CFA ®) Volume 1

Video thumbnail

Statistics - 8.2 Student's t-Distribution

In this video, we explore a probability distribution model closely related to the normal model. It is called the student's t-distribution. We will use this in scenarios where we are trying to estimate a population mean but do not know the population standard deviation (sigma). Power Poin

From playlist Applied Statistics (Entire Course)

Video thumbnail

The t Distribution: A BREWER’S Solution for Small Samples (13-4)

In the early days of statistics, the lack of replicability created skepticism that statistics could be a science. When using small samples, the results were inconsistent. William Sealy Gosset, a scientist-brewer at Guinness Brewing Company solved the problem of small sample sizes by adjust

From playlist Estimating Intervals, Point Estimators, and Confidence Intervals (WK 13 - QBA 237)

Video thumbnail

Confidence Intervals using a t Distribution when Estimating Population (Week 13C)

Unfortunately, we rarely know the mean and SD of the population we are sampling. Yes, we can estimate population parameters from our sample statistics, but the SD estimations are biased when our sample sizes are small. Therefore, we need to adjust for that bias using a t distribution and a

From playlist Basic Business Statistics (QBA 237 - Missouri State University)

Video thumbnail

Guinness, Student, and the History of t Tests (10-1)

We concluded our lesson on z tests with the sad realization that z tests rarely get used in the real world. Instead of using a z test we compare samples to populations using a t test. William Sealy Gosset, a master brewer and a scientist at the Guinness brewery in Dublin, Ireland solved th

From playlist WK10 One Sample t Tests - Online Statistics for the Flipped Classroom

Video thumbnail

ANOVA.4.F Distribution Sums of Squares 4

This video is brought to you by the Quantitative Analysis Institute at Wellesley College. The material is best viewed as part of the online resources that organize the content and include questions for checking understanding: https://www.wellesley.edu/qai/onlineresources

From playlist ANOVA

Video thumbnail

07e Python Data Analytics: Hypothesis Testing Interactive

Interactive discussion of hypothesis testing with a short lecture and use of my interactive hypothesis testing based on Python in Jupyter Notebook. Teh code is available on my GitHub repository (GeostatsGuy) at https://github.com/GeostatsGuy/PythonNumericalDemos/blob/master/Interactive_Hyp

From playlist Data Analytics and Geostatistics

Related pages

Triangular distribution | Indeterminate form | Bayes' theorem | Bessel's correction | Quantile | Posterior predictive distribution | P-value | Precision (statistics) | Multivariate t-distribution | Regression analysis | Linear function | Bessel function | Box–Muller transform | Conjugate prior | Gamma distribution | F-distribution | Mean | Skewness | Chi-squared distribution | Cumulative distribution function | Logarithm | Location parameter | Noncentral t-distribution | Probability | Probability density function | Quantile function | Null hypothesis | Standard score | Statistical population | Statistics | Prediction interval | Curse of dimensionality | Independence (probability theory) | Hypergeometric function | Multivariate normal distribution | Confidence interval | Marginal distribution | Prosecutor's fallacy | Bayesian statistics | Hotelling's T-squared distribution | Digamma function | Grubbs's test | Scaled inverse chi-squared distribution | Standard normal table | T-statistic | Pivotal quantity | Error function | Scale parameter | Variance | Student's t-test | Folded-t and half-t distributions | Gamma function | Robust statistics | Spearman's rank correlation coefficient | Jeffreys prior | Maximum entropy probability distribution | R (programming language) | Probability distribution | Real number | Normal distribution | Standard deviation | Cochran's theorem | Beta function | Random variable | Degrees of freedom (statistics) | Cauchy distribution | Expected value | Irwin–Hall distribution | Sampling distribution | Wishart distribution | Gaussian process | Statistical significance | Probability mass function | Sample variance | Pearson distribution