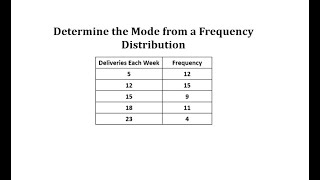
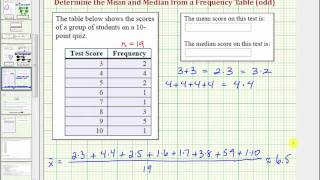
In statistics, the frequency (or absolute frequency) of an event is the number of times the observation occurred/recorded in an experiment or study. These frequencies are often depicted graphically or in tabular form. (Wikipedia).
Frequency (1 of 2: Introduction to Relative, Cumulative and Grouped/Classed Frequency)
More resources available at www.misterwootube.com
From playlist Data Analysis
Cumulative Frequency (1 of 2: Basic calculations)
More resources available at www.misterwootube.com
From playlist Descriptive Statistics & Bivariate Data Analysis
How to Create a Frequency Table – Simple, Cumulative, Relative Frequency & Percentile (3-3)
Now that we understand what frequency is, we will create a frequency table. The table will include columns for our variable, simple frequency, relative frequency, cumulative frequency, and percentiles. The term simple frequency refers to the number of times a score occurs in the data se
From playlist WK3 Frequency - Online Statistics for the Flipped Classroom
How to Find the Cumulative Frequencies from a Frequency Distribution
Please Subscribe here, thank you!!! https://goo.gl/JQ8Nys How to Find the Cumulative Frequencies from a Frequency Distribution
From playlist Statistics
Determine the Mode from a Frequency Table
This video explains how to determine the mode of a data set given in a frequency table.
From playlist Statistics: Describing Data
Statistics - How to make a frequency distribution
This video covers how to make a frequency distribution chart. Remember that the frequency simply shows how often a data point is on you list. For more videos visit http://mysecretmathtutor.com
From playlist Statistics
Introduction to Frequency Distributions in Statistics (3-2)
Frequency is a descriptive statistic that organizes data into a distribution. A frequency distribution is a graphical display that tells us how many scores we have in total and how often each of those scores appears in our data set. A distribution is the general name for any organized set
From playlist WK3 Frequency - Online Statistics for the Flipped Classroom
Frequency (2 of 2: Finding the Cumulative Frequency and Relative Frequency from Frequency tables)
More resources available at www.misterwootube.com
From playlist Data Analysis
Ex: Find the Mean and Median of a Data Set Given in a Frequency Table (odd)
This video explains how to determine the mean and median of a data set given in a frequency table. There is an odd number of data values. http://mathispower4u.com
From playlist Statistics: Describing Data
Introduction to group-level statistical analyses, and implementation in Matlab. The video uses files you can download from https://github.com/mikexcohen/ANTS_youtube_videos For more online courses about programming, data analysis, linear algebra, and statistics, see http://sincxpress.com
From playlist OLD ANTS #8) Statistics
Descriptive Statistics for Categorical Data - Statistics with SPSS 27 for Beginners (4 of 8)
Dr. Daniel, Diva, and Desi explain categorical variables and show you how to display them in tables, as numbers, and with graphs. You learn the correct choices for describing categorical data using the Dog Toys dataset and the FREQUENCIES menu in SPSS. We create frequency tables and bar c
From playlist Introduction to Statistics with IBM SPSS 27 for Beginners (with Puppies)
Describing Frequency: SIMPLE, Relative, and Percent Frequency (3-3)
Simple frequency is the number of times a score occurs, or the counts of frequency in each category. Relative frequency is the proportion of the times a score occurs, a number between 1 and 0 that indicates a fraction of the total. Percent frequency is the percentage of the times a score o
From playlist Describing Data with Descriptive Statistics (WK 3 - QBA 237)
Statistical Analysis And Business Applications | Data Science With Python Tutorial
🔥 Advanced Certificate Program In Data Science: https://www.simplilearn.com/pgp-data-science-certification-bootcamp-program?utm_campaign=StatisticalAnalysis-kEN-YsAkEMs&utm_medium=Descriptionff&utm_source=youtube 🔥 Data Science Bootcamp (US Only): https://www.simplilearn.com/data-science-b
FREQUENCY Distributions for Categorical Data (3-2)
Frequency is a type of descriptive statistic that shows how often a score occurs in a distribution by organizing the data into a table. Distribution is the general name for any organized set of data. Frequency distributions are presented in tables showing the number (frequency) of observat
From playlist Describing Data with Descriptive Statistics (WK 3 - QBA 237)
Interpreting time-frequency plots
This video lesson is part of a complete course on neuroscience time series analyses. The full course includes - over 47 hours of video instruction - lots and lots of MATLAB exercises and problem sets - access to a dedicated Q&A forum. You can find out more here: https://www.udem
From playlist NEW ANTS #1) Introductions
Three approaches for group-level statistics
This video lesson is part of a complete course on neuroscience time series analyses. The full course includes - over 47 hours of video instruction - lots and lots of MATLAB exercises and problem sets - access to a dedicated Q&A forum. You can find out more here: https://www.udemy.
From playlist NEW ANTS #5) Permutation-based statistics
Excel 2013 Statistical Analysis #72: Chi-Square Test For 2 or More Population Proportions (Formulas)
Download files (which file shown at begin of video): https://people.highline.edu/mgirvin/AllClasses/210Excel2013/Ch11/Ch11.htm Topics in this video: 1. (00:14) Introduction to “Hypothesis Test to check Equality of 2 or more Population Proportions using Chi-Square” with Example of check the
From playlist Excel for Statistical Analysis in Business & Economics Free Course at YouTube (75 Videos)
Suhasini Subba Rao: Fourier based methods for spatial data observed on irregularly spaced locations
Abstract : In this talk we introduce a class of statistics for spatial data that is observed on an irregular set of locations. Our aim is to obtain a unified framework for inference and the statistics we consider include both parametric and nonparametric estimators of the spatial covarianc
From playlist Probability and Statistics
Introduction to non-parametric permutation testing, and implementation in a within-subjects (cross-trial) analysis. The video uses files you can download from https://github.com/mikexcohen/ANTS_youtube_videos For more online courses about programming, data analysis, linear algebra, and s
From playlist OLD ANTS #8) Statistics
Ex: Find the Mean and Median of a Data Set Given in a Frequency Table (even)
This video explains how to determine the mean and median of a data set given in a frequency table. There is an even number of data values. http://mathispower4u.com
From playlist Statistics: Describing Data