
Statistics 3 Measures of Central Tendency.mov
Discussing measures of central tendency, such as mean or average, median, and mode.
From playlist Medical Statistics

Excel for Statistics 2--Central Tendency
This video describes different measures of central tendency and how to calculate them in Excel.
From playlist RStats Videos

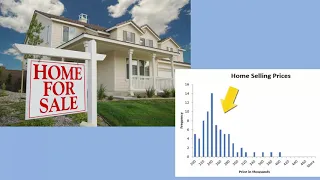
What is Central Tendency – An Introduction to Mean, Median, and Mode in Statistics (5-1)
When we seek to organize our jumbled data, our first question is “what single number best represents our data?” The answer is a measure of central tendency: where does the CENTER of our data TEND to be? There are three measures that we will dig into: mean, median, and mode. Later, we will
From playlist WK5 Measures of Central Tendency (Mean, Median, Mode) - Online Statistics for the Flipped Classroom
Mean v median: Measures of Central Tendency
Intro to measures of central tendency
From playlist Unit 1: Descriptive Statistics
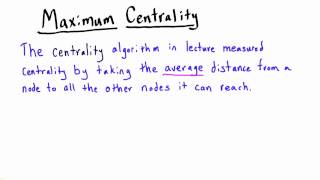
Centrality - Intro to Algorithms
This video is part of an online course, Intro to Algorithms. Check out the course here: https://www.udacity.com/course/cs215.
From playlist Introduction to Algorithms
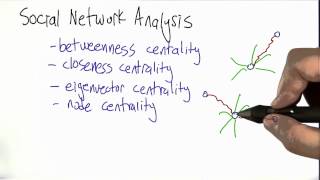
Types Of Centrality - Intro to Algorithms
This video is part of an online course, Intro to Algorithms. Check out the course here: https://www.udacity.com/course/cs215.
From playlist Introduction to Algorithms


Review of the three main measures of central tendency.
From playlist Common Core Standards - 7th Grade

Explaining CENTRAL Tendency and Variability for Statistics (5-2)
The first two questions that we will have about any distribution is (1) where is the center of the distribution and (2) how close together or spread out are the scores? We answer the first question with central tendency. Central tendency is a single number that represents all of the other
From playlist Central Tendency and Variability in Statistics (WK 5 - QBA 237)
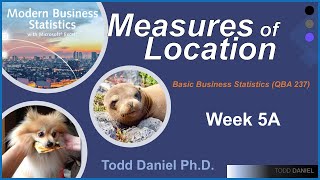
Measures of Location, Mean, Median, Mode and Central Tendency in Business Statistics (Week 5A)
Three measures of central tendency (i.e. location) tell us mean, median, and mode of data. We choose our measure of location based on the level of the data, such as the mode for nominal, median for ordinal, and mean for scale variables. We may change our measure of location based on the ch
From playlist Basic Business Statistics (QBA 237 - Missouri State University)
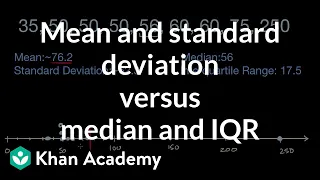
Mean and standard deviation versus median and IQR | AP Statistics | Khan Academy
Learn to choose the "preferred" measures of center and spread when outliers are present in a set of data. View more lessons or practice this subject at http://www.khanacademy.org/math/ap-statistics/summarizing-quantitative-data-ap/measuring-spread-quantitative/v/mean-and-standard-deviatio
From playlist Summarizing quantitative data | AP Statistics | Khan Academy

Descriptive Statistics Lecture
Lecturer: Michael Mizer Recorded: Fall 2015 Learn more about descriptive statistics! Learn more and find our documents on our OSF page: https://osf.io/e3d9w/. Look at our basic statistics page for complete lecture series: https://statisticsofdoom.com/page/basic-statistics/
From playlist Basic Statistics Videos

Computing Central Tendency (Mean, Median, Mode) in JASP (5-9)
We walk through the steps to identify three measures of central tendency (mean, median, and mode) using JASP. This is an excellent introduction to JASP software and some of the functions that we will use throughout the introductory statistics course. Download the Friendly, Free, Flexib
From playlist Discovering Statistics with JASP

How to CHOOSE a Measure of Central Tendency and Variability (5-3)
The challenge in learning about central tendency and variability is knowing when to choose a specific measure. The key, as always, is to first consider the level of measurement of the variable we want to describe. Then, Dr. Daniel provides a flow chart to help choose which measure of centr
From playlist Central Tendency and Variability in Statistics (WK 5 - QBA 237)

04 Data Analytics: Univariate Statistics
Lecture on univariate statistics related to distribution central tendency, dispersion and shape. Follow along with the demonstration workflow in Python: o. Examples of calculating univariate statistics: https://github.com/GeostatsGuy/PythonNumericalDemos/blob/master/PythonDataBasics_Univ
From playlist Data Analytics and Geostatistics

Locating Boundaries of a Distribution from its Median
More resources available at www.misterwootube.com
From playlist Random Variables

Average or Central Tendency: Arithmetic Mean, Median, and Mode
Average or Central Tendency: Arithmetic Mean, Median, and Mode
From playlist ck12.org Algebra 1 Examples