
The Normal Distribution (1 of 3: Introductory definition)
More resources available at www.misterwootube.com
From playlist The Normal Distribution
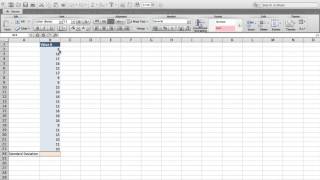
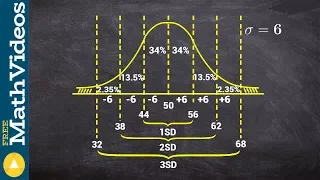
The dispersion of data by means of the standard deviation.
From playlist Medical Statistics
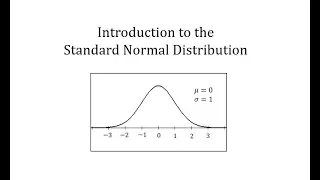
Introduction to the Standard Normal Distribution
This video introduces the standard normal distribution http://mathispower4u.com
From playlist The Normal Distribution

Normal Distribution: Find Probability Given Z-scores Using a Free Online Calculator
This video explains how to determine normal distribution probabilities given z-scores using a free online calculator. http://dlippman.imathas.com/graphcalc/graphcalc.html
From playlist The Normal Distribution
Normal Distribution: Find Probability Given Z-scores Using a Free Online Calculator (MOER/MathAS)
This video explains how to determine normal distribution probabilities given z-scores using a free online calculator. https://oervm.s3-us-west-2.amazonaws.com/stats/probs.html
From playlist The Normal Distribution

Determining values of a variable at a particular percentile in a normal distribution
From playlist Unit 2: Normal Distributions

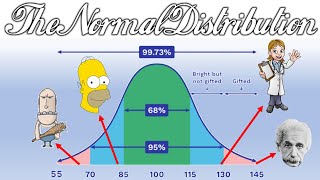
Normal Distribution Definition and Properties
What is a normal distribution? Properties of a normal distribution, including the empirical rule.
From playlist Probability Distributions
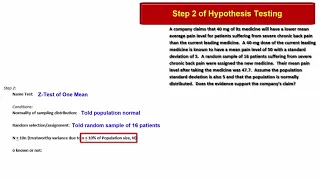
Execution and write-up of a hypothesis test of means [in accordance with AP Statistics requirements]
From playlist Unit 8: Hypothesis Tests & Confidence Intervals for Single Means & for Single Proportions

Statistics Lecture 3.3: Finding the Standard Deviation of a Data Set
https://www.patreon.com/ProfessorLeonard Statistics Lecture 3.3: Finding the Standard Deviation of a Data Set
From playlist Statistics (Full Length Videos)

From playlist STAT 200 Video Lectures

Lecturer: Dr. Erin M. Buchanan Spring 2020 Learn how to complete a single sample t-test with JASP! Learn more and find our documents on our OSF page: https://osf.io/t56kg/. Look at our basic statistics page for complete lecture: https://statisticsofdoom.com/page/basic-statistics/.
From playlist Learn JASP + Statistics

How to test variables for normality in SPSS with the Shapiro-Wilk and KS Test.
From playlist SPSS

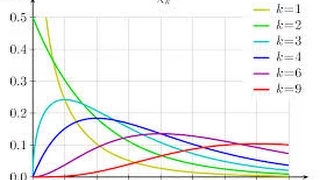
5 Probability Distributions you should know as a Data Scientist
Here are a few probability distributions you should know as a data scientist Follow me on M E D I U M: https://towardsdatascience.com/likelihood-probability-and-the-math-you-should-know-9bf66db5241b JOIN US ON DISCORD: https://discord.gg/3C6fKZ3E5m SPONSOR Kite is a free AI-powered codi
From playlist The Math You Should Know
The Assumption of NORMALITY in Parametric Hypothesis Tests (16-6)
Parametric statistical tests require normality, which does not mean what many people think it means. I explain the true meaning of the assumption of normality, using Stats Blocks, and how to test this assumption with graphs or tests, such as Kolmogorov-Smirnov Test. The Central Limit Theor
From playlist Assumptions, Significance, & Effect Size Wrap-Up (WK 16 - QBA 237)

ANOVA in RStudio Part 1 | Visualization, Normality Assumption, Homogeneity of Variance
In these two installments, I demonstrate how to run an #ANOVA test in #RStudio. Specifically, in the first video, I will discuss: 1 Data visualization 2 Assumption 1. Normality (of residuals) 3 Assumption 2. Homogeneity of variances: Levene's test; Bartlett's test In the second video,
From playlist Repeated Measures ANOVA

Lecturer: Dr. Erin M. Buchanan Spring 2020 Learn how to complete a dependent t-test in JASP! Learn more and find our documents on our OSF page: https://osf.io/t56kg/. Look at our basic statistics page for complete lecture: https://statisticsofdoom.com/page/basic-statistics/.
From playlist Learn JASP + Statistics
Chi Square Test: Interpretation of (O-E)^2/E
In this video, I try to show how the (O-E)^2/E calculation in a chi-squared test is connected the sum of squared z-scores, something visually closer to the definition of a chi-squared distribution. The video should be understandable to new students of stats and more advanced ones.
From playlist Math

Independent samples t-test and Mann-Whitney U test in Jamovi
This videos shows how to run independent samples t-test and Mann-Whitney U test in Jamovi, which is a free software package. Jamovi download: https://www.jamovi.org/download.html
From playlist Independent Samples t-Test
Year 13/A2 Statistics Chapter 3.7 (The Normal Distribution)
Welcome to the final lesson on the normal distribution for Year 13. The focus for the last subchapter is explaining that, if a random variable is normally distributed, then so will be the distribution of its sample mean. The sample mean can be used in normal hypothesis tests, as can the no
From playlist Year 13/A2 Statistics
Using normal distribution to find the probability
👉 Learn how to find probability from a normal distribution curve. A set of data are said to be normally distributed if the set of data is symmetrical about the mean. The shape of a normal distribution curve is bell-shaped. The normal distribution curve is such that the mean is at the cente
From playlist Statistics