QRM L1-1: The Definition of Risk
Welcome to Quantitative Risk Management (QRM). In this first class, we define what risk if for us. We will discuss the basic characteristics of risk, underlining some important facts, like its subjectivity, and the impossibility of separating payoffs and probabilities. Understanding the d
From playlist Quantitative Risk Management

QRM L1-2: The dimensions of risk and friends
Welcome to Quantitative Risk Management (QRM). In this second video, we analyse the dimensions of risk. Risk is in fact an object that we need to consider from different points of view, and that sometimes we cannot even quantify. We will also discuss the importance of statistical thinking
From playlist Quantitative Risk Management

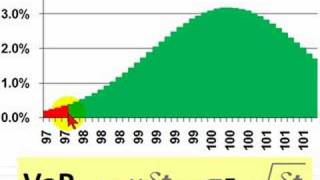
What is Value at Risk? VaR and Risk Management
In todays video we learn about Value at Risk (VaR) and how is it calculated? Buy The Book Here: https://amzn.to/37HIdEB Follow Patrick on Twitter Here: https://twitter.com/PatrickEBoyle What Is Value at Risk (VaR)? Value at risk (VaR) is a calculation that aims to quantify the level of
From playlist Risk Management

Risk Management Lesson 5A: Value at Risk
In this first part of Lesson 5, we discuss Value-at-Risk (VaR). Topics: - Definition of VaR - Loss distribution and confidence level - The normal VaR
From playlist Risk Management


Welcome to Quantitative Risk Management (QRM). In this lesson we introduce the axiomatic approach to risk measures. We give the definition of risk measure and we discuss what its uses for us are in terms of reserve capital quantification. We then define coherent and convex measures. The p
From playlist Quantitative Risk Management
FRM: Parametric value at risk (VaR): Pros & Cons
Here is a quick explanation of parametric value at risk (VaR) as a means to illustrating its strengths/weaknesses. Please note: The essence of parametric VaR is "no data:" while historical data is surely used to select a distribution and calibrate its parameters, a parametric VaR leans on
From playlist Value at Risk (VaR): Introduction

(PP 3.1) Random Variables - Definition and CDF
(0:00) Intuitive examples. (1:25) Definition of a random variable. (6:10) CDF of a random variable. (8:28) Distribution of a random variable. A playlist of the Probability Primer series is available here: http://www.youtube.com/view_play_list?p=17567A1A3F5DB5E4
From playlist Probability Theory
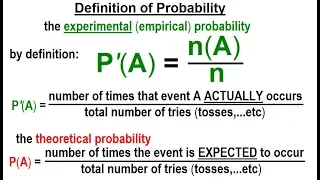
Statistics: Ch 4 Probability in Statistics (20 of 74) Definition of Probability
Visit http://ilectureonline.com for more math and science lectures! To donate: http://www.ilectureonline.com/donate https://www.patreon.com/user?u=3236071 We will learn the “strict” definition of experimental (empirical) and theoretical probability. Next video in this series can be seen
From playlist STATISTICS CH 4 STATISTICS IN PROBABILITY

From playlist Contributed talks One World Symposium 2020

Stanford Webinar - Data Overload: Making Sense of Statistics in the News, Kristin Sainani
Between the COVID-19 pandemic and the 2020 U.S. election we are bombarded with statistics at every turn. Just reading the news requires a level of statistical literacy that many of us lack. Fortunately, the news also provides a rich set of stories that can make learning statistics more fun
From playlist Stanford Center for Health Education (SCHE)

How Not to Fall for Bad Statistics - with Jennifer Rogers
Living is a risky business. If you believe the headlines, bacon is as deadly as smoking and fizzy drinks make children violent, but is that true? Subscribe for regular science videos: http://bit.ly/RiSubscRibe From causation and correlation, to relative and absolute risk, Jennifer Rogers
From playlist Mathematics


Daniel Yekutieli: Hierarchical Bayes Modeling for Large-Scale Inference
CIRM VIRTUAL EVENT Recorded during the meeting "Mathematical Methods of Modern Statistics 2" the June 03, 2020 by the Centre International de Rencontres Mathématiques (Marseille, France) Filmmaker: Guillaume Hennenfent Find this video and other talks given by worldwide mathematicians
From playlist Virtual Conference

David Spiegelhalter: Communicating statistics in the time of COVID | The Royal Society
Winner of the 2020 Michael Faraday Prize and Lecture, Professor David Spiegelhalter discusses his work in statistics and how to understand risk with Tim Harford, columnist, broadcaster and author of How To Make The World Add Up. Professor David Spiegelhalter is Chair of the Winton Centre
From playlist Covid-19

Can We Trust Maths? - with Kit Yates
Mathematics is everywhere, in all of our lives. Whether it’s used for medicine, in the media or in the world of politics, we can’t escape it - but can we always trust how it's used? Kit’s book "The Maths of Life and Death" is available now - https://geni.us/jWrj7u8 Watch the Q&A: https:/
From playlist Mathematics

Types of statistical studies | Statistical studies | Probability and Statistics | Khan Academy
Practice this lesson yourself on KhanAcademy.org right now: https://www.khanacademy.org/math/probability/statistical-studies/types-of-studies/e/types-of-statistical-studies?utm_source=YT&utm_medium=Desc&utm_campaign=ProbabilityandStatistics Watch the next lesson: https://www.khanacademy.
From playlist High school statistics | High School Math | Khan Academy
Stanford Webinar - How to Analyze Research Data: Kristin Sainani
In this webinar, Associate Professor Kristin Sainani walks you through the steps of a complete data analysis, using real data on mental health in athletes. She provides practical, hands-on tips for how to approach each step of the analysis and how to improve rigor and reproducibility of yo
From playlist Statistics and Data Science

Excel Statistical Analysis 43: Hypothesis Testing: P-value & Critical Value Methods: 1 Tail Upper
Download Excel File: https://excelisfun.net/files/Ch09-ESA.xlsm Download 2 PDF note files: https://excelisfun.net/files/Ch09-ESA.pdf, https://excelisfun.net/files/Ch09-ESA-JustFormulas.pdf Learn about the 5 steps in hypothesis testing. Learn how to run a hypothesis test in Excel. Topics
From playlist Excel Statistical Analysis for Business Class Playlist of Videos from excelisfun
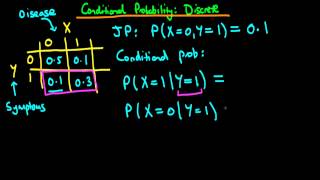
What is a conditional probability?
An introduction to the concept of conditional probabilities via a simple 2 dimensional discrete example. If you are interested in seeing more of the material, arranged into a playlist, please visit: https://www.youtube.com/playlist?list=PLFDbGp5YzjqXQ4oE4w9GVWdiokWB9gEpm For more inform
From playlist Bayesian statistics: a comprehensive course