Cluster analysis | Data mining
Cluster analysis
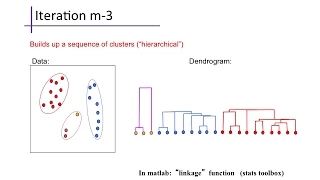
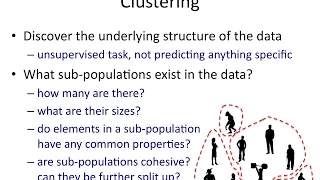
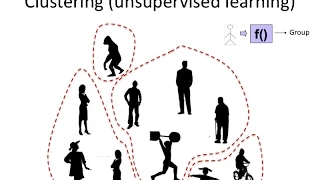
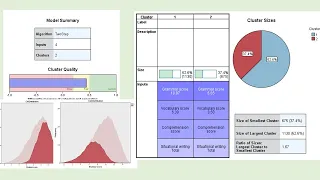
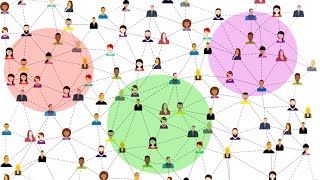
Cluster analysis or clustering is the task of grouping a set of objects in such a way that objects in the same group (called a cluster) are more similar (in some sense) to each other than to those in other groups (clusters). It is a main task of exploratory data analysis, and a common technique for statistical data analysis, used in many fields, including pattern recognition, image analysis, information retrieval, bioinformatics, data compression, computer graphics and machine learning. Cluster analysis itself is not one specific algorithm, but the general task to be solved. It can be achieved by various algorithms that differ significantly in their understanding of what constitutes a cluster and how to efficiently find them. Popular notions of clusters include groups with small distances between cluster members, dense areas of the data space, intervals or particular statistical distributions. Clustering can therefore be formulated as a multi-objective optimization problem. The appropriate clustering algorithm and parameter settings (including parameters such as the distance function to use, a density threshold or the number of expected clusters) depend on the individual data set and intended use of the results. Cluster analysis as such is not an automatic task, but an iterative process of knowledge discovery or interactive multi-objective optimization that involves trial and failure. It is often necessary to modify data preprocessing and model parameters until the result achieves the desired properties. Besides the term clustering, there is a number of terms with similar meanings, including automatic classification, numerical taxonomy, botryology (from Greek βότρυς "grape"), typological analysis, and community detection. The subtle differences are often in the use of the results: while in data mining, the resulting groups are the matter of interest, in automatic classification the resulting discriminative power is of interest. Cluster analysis was originated in anthropology by Driver and Kroeber in 1932 and introduced to psychology by Joseph Zubin in 1938 and Robert Tryon in 1939 and famously used by Cattell beginning in 1943 for trait theory classification in personality psychology. (Wikipedia).