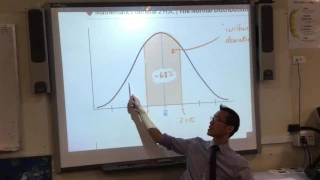
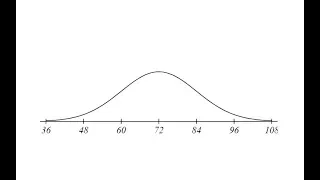
Normal distribution | Continuous distributions
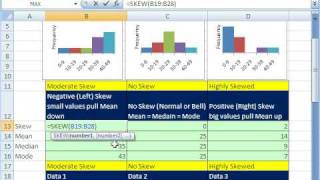
Skew normal distribution
In probability theory and statistics, the skew normal distribution is a continuous probability distribution that generalises the normal distribution to allow for non-zero skewness. (Wikipedia).