Control theory | Signal processing

Frequency response

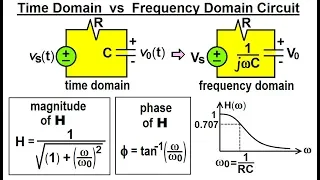
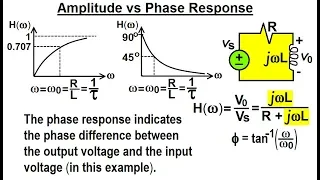
In signal processing and electronics, the frequency response of a system is the quantitative measure of the magnitude and phase of the output as a function of input frequency. The frequency response is widely used in the design and analysis of systems, such as audio and control systems, where they simplify mathematical analysis by converting governing differential equations into algebraic equations. In an audio system, it may be used to minimize audible distortion by designing components (such as microphones, amplifiers and loudspeakers) so that the overall response is as flat (uniform) as possible across the system's bandwidth. In control systems, such as a vehicle's cruise control, it may be used to assess system stability, often through the use of Bode plots. Systems with a specific frequency response can be designed using analog and digital filters. The frequency response characterizes systems in the frequency domain, just as the impulse response characterizes systems in the time domain. In linear systems, either response completely describes the system and thus have one-to-one correspondence: the frequency response is the Fourier transform of the impulse response. The frequency response allows simpler analysis of cascaded systems such as multistage amplifiers, as the response of the overall system can be found through multiplication of the individual stages' frequency responses (as opposed to convolution of the impulse response in the time domain). The frequency response is closely related to the transfer function in linear systems, which is the Laplace transform of the impulse response. They are equivalent when the real part of the transfer function's complex variable is zero. (Wikipedia).

Frequency response
Video thumbnail

Frequency Response Descriptions for LTI Systems

http://AllSignalProcessing.com for free e-book on frequency relationships and more great signal processing content, including concept/screenshot files, quizzes, MATLAB and data files. An introduction to the description of the input output characteristics of linear time-invariant systems b

From playlist Introduction and Background

Video thumbnail

Frequency Response Magnitude and Poles and Zeros

http://AllSignalProcessing.com for more great signal processing content, including concept/screenshot files, quizzes, MATLAB and data files. Graphical interpretation of the magnitude response of a system described by a linear constant-coefficient difference equation in terms of the locati

From playlist The z-Transform

Video thumbnail

Frequency (1 of 2: Introduction to Relative, Cumulative and Grouped/Classed Frequency)

More resources available at www.misterwootube.com

From playlist Data Analysis

Video thumbnail

Amazing science experiment-Demonstrating beat frequency

A beat is an interference pattern between two sounds of slightly different in frequencies You can download this app or a similar app on two devices and TRY it at home Enjoy!!!

From playlist Beats

Video thumbnail

Amazing science experiment-Demonstrating beat frequency

A beat is an interference pattern between two sounds of slightly different in frequencies You can download this app or a similar app on two devices and TRY it at home Enjoy!!!

From playlist Beats

Video thumbnail

Waves 2_2 Wavelength Frequency and Speed

Lecture on wavelength, frequency and longitudinal and transverse speed of waves

From playlist Physics - Waves

Video thumbnail

Electrical Engineering: Ch 15: Frequency Response (7 of 56) Phase Response in RC Circuit

Visit http://ilectureonline.com for more math and science lectures! In this video I will explain the phase response in a RC circuit using a simple RC circuit with a voltage source where the transfer function is the ratio of the output voltage over the input voltage. http://www.ilectureon

From playlist ELECTRICAL ENGINEERING 15 FREQUENCY RESPONSE

Video thumbnail

Electrical Engineering: Ch 15: Frequency Response (4 of 56) Time vs Frequence Domain Circuit

Visit http://ilectureonline.com for more math and science lectures! In this video I will explain the difference between the time domain and the frequency domain circuit. In the frequency we are dealing with phasors and in the time domain we are dealing with the voltage and current as a fu

From playlist ELECTRICAL ENGINEERING 15 FREQUENCY RESPONSE

Video thumbnail

Electrical Engineering: Ch 15: Frequency Response (1 of 56) What is a Transfer Function? 1 of 3

Visit http://ilectureonline.com for more math and science lectures! In this video I will explain what is a transfer function – the frequency dependent ratio (represented by a number between 0 and 1) of the output vs input voltage (or current). http://www.ilectureonline.com/donate https:/

From playlist ELECTRICAL ENGINEERING 15 FREQUENCY RESPONSE

Video thumbnail

Lec 17 | MIT RES.6-008 Digital Signal Processing, 1975

Lecture 17: Design of FIR digital filters Instructor: Alan V. Oppenheim View the complete course: http://ocw.mit.edu/RES6-008S11 License: Creative Commons BY-NC-SA More information at http://ocw.mit.edu/terms More courses at http://ocw.mit.edu

From playlist MIT RES.6-008 Digital Signal Processing, 1975

Video thumbnail

3. Introduction to Systems with Dynamics

MIT Electronic Feedback Systems (1985) View the complete course: http://ocw.mit.edu/RES6-010S13 Instructor: James K. Roberge License: Creative Commons BY-NC-SA More information at http://ocw.mit.edu/terms More courses at http://ocw.mit.edu

From playlist MIT Electronic Feedback Systems (1985)

Video thumbnail

13. Frequency response of LTI systems

MIT 6.02 Introduction to EECS II: Digital Communication Systems, Fall 2012 View the complete course: http://ocw.mit.edu/6-02F12 Instructor: George Verghese This lecture continues the discussion of properties of the frequency response and the shift from time to frequency domain. Examples o

From playlist MIT 6.02 Introduction to EECS II: Digital Communication Systems, Fall 2012

Video thumbnail

Demonstration 1: Sampling

Demonstration 1: Sampling, aliasing, and frequency response, part 1 Instructor: Alan V. Oppenheim View the complete course: http://ocw.mit.edu/RES6-008S11 License: Creative Commons BY-NC-SA More information at http://ocw.mit.edu/terms More courses at http://ocw.mit.edu

From playlist MIT RES.6-008 Digital Signal Processing, 1975

Video thumbnail

Lec 15 | MIT RES.6-008 Digital Signal Processing, 1975

Lecture 15: Design of IIR digital filters, part 2 Instructor: Alan V. Oppenheim View the complete course: http://ocw.mit.edu/RES6-008S11 License: Creative Commons BY-NC-SA More information at http://ocw.mit.edu/terms More courses at http://ocw.mit.edu

From playlist MIT RES.6-008 Digital Signal Processing, 1975

Video thumbnail

Lecture 18, Discrete-Time Processing of Continuous-Time Signals | MIT RES.6.007 Signals and Systems

Lecture 18, Discrete-Time Processing of Continuous-Time Signals Instructor: Alan V. Oppenheim View the complete course: http://ocw.mit.edu/RES-6.007S11 License: Creative Commons BY-NC-SA More information at http://ocw.mit.edu/terms More courses at http://ocw.mit.edu

From playlist MIT RES.6.007 Signals and Systems, 1987

Video thumbnail

9. Frequency Response

MIT MIT 6.003 Signals and Systems, Fall 2011 View the complete course: http://ocw.mit.edu/6-003F11 Instructor: Dennis Freeman License: Creative Commons BY-NC-SA More information at http://ocw.mit.edu/terms More courses at http://ocw.mit.edu

From playlist MIT 6.003 Signals and Systems, Fall 2011

Video thumbnail

Lec 14 | MIT RES.6-008 Digital Signal Processing, 1975

Lecture 14: Design of IIR digital filters, part 1 Instructor: Alan V. Oppenheim View the complete course: http://ocw.mit.edu/RES6-008S11 License: Creative Commons BY-NC-SA More information at http://ocw.mit.edu/terms More courses at http://ocw.mit.edu

From playlist MIT RES.6-008 Digital Signal Processing, 1975

Video thumbnail

Electrical Engineering: Ch 15: Frequency Response (6 of 56) Amplitude vs Phase Response

Visit http://ilectureonline.com for more math and science lectures! In this video we will take a closer look at the difference between amplitude vs phase response using a simple RL circuit with a voltage source. http://www.ilectureonline.com/donate https://www.patreon.com/user?u=3236071

From playlist ELECTRICAL ENGINEERING 15 FREQUENCY RESPONSE

Video thumbnail

EEVblog #396 - Bode Plotting on Your Osciloscope

Dave shows you a neat trick on how to get a real time frequency response bode plot on your oscilloscope using your function generator. Useful for filter or system response characterisation. Forum Topic: http://www.eevblog.com/forum/blog/eevblog-396-bode-plotting-on-your-osciloscope/ Spect

From playlist Test Instrument Tutorials

Related pages

Nyquist plot | Decibel | White noise | Signal processing | Window function | Control system | Hertz | Nyquist rate | Sampling (signal processing) | Transfer function | Resonance | Frequency domain | Impulse response | Laplace transform | Radian | Time domain | Bode plot | Dirac delta function | Fast Fourier transform | Convolution | Stability theory | Bandwidth (signal processing) | Linear system | Transient response | Spectral leakage | Fourier transform | Nichols plot | Digital filter