Time–frequency analysis | Signal processing

Spectrogram

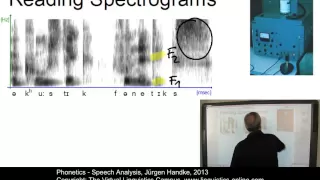
A spectrogram is a visual representation of the spectrum of frequencies of a signal as it varies with time. When applied to an audio signal, spectrograms are sometimes called sonographs, voiceprints, or voicegrams. When the data are represented in a 3D plot they may be called waterfall displays. Spectrograms are used extensively in the fields of music, linguistics, sonar, radar, speech processing, seismology, and others. Spectrograms of audio can be used to identify spoken words phonetically, and to analyse the various calls of animals. A spectrogram can be generated by an optical spectrometer, a bank of band-pass filters, by Fourier transform or by a wavelet transform (in which case it is also known as a scaleogram or scalogram). A spectrogram is usually depicted as a heat map, i.e., as an image with the intensity shown by varying the colour or brightness. (Wikipedia).

Spectrogram
Video thumbnail

Building a Nanodrop Style UV/Vis Spectrometer

Spectrometers are one of the most ubiquitous tools in most labs because an enormous amount of information about a substance can be gleaned from how it interacts with various parts of the electromagnetic spectrum. But for as common as they are, the price tag on a new spectrometer can be mas

From playlist Biology and Genetics

Video thumbnail

The Spectrogram and the Gabor Transform

Here I introduce the spectrogram, which is a moving-window Fourier transform, giving insight into the time-frequency content of a data set. Book Website: http://databookuw.com Book PDF: http://databookuw.com/databook.pdf These lectures follow Chapter 2 from: "Data-Driven Science and E

From playlist Data-Driven Science and Engineering

Video thumbnail

PHO_017 - Linguistic Micro-Lectures: Spectrograms

In this short micro-lecture, Miriam Fingerhut, one of Prof. Handke's students, presents the topic of 'spectrograms', a central issue in acoustic phonetics.

From playlist Micro-Lectures - Phonetics

Video thumbnail

Spectrophotometry and Beer's Law

We've learned about kinetics already, but how do we gather kinetic data? One clever method is by analyzing how the color of a solution changes over time, which is an indication of the concentration of certain compounds that interact with light in a specific way. This technique is called sp

From playlist General Chemistry

Video thumbnail

Multimeter Review / DMM Review / buyers guide / tutorial

A list of my multimeters can be purchased here: http://astore.amazon.com/m0711-20?_encoding=UTF8&node=5 In this video I do a review of several digital multimeters. I compare features and functionality. I explain safety features, number of digits, display count, accuracy and resolution. Th

From playlist Multimeter reviews, buyers guide and comparisons.

Video thumbnail

Quantization and Coding in A/D Conversion

http://AllSignalProcessing.com for more great signal-processing content: ad-free videos, concept/screenshot files, quizzes, MATLAB and data files. Real sampling systems use a limited number of bits to represent the samples of the signal, resulting in quantization of the signal amplitude t

From playlist Sampling and Reconstruction of Signals

Video thumbnail

Introduction to Geometer's Sketchpad: Measurements

This video demonstrates some of the measurement and calculation features of Geometer's Sketchpad.

From playlist Geometer's Sketchpad

Video thumbnail

Statistics - How to make a histogram

This example shows how to make a histogram. Remember that the horizontal axis represents the values of the variables. The vertical axis gives us the frequency of those variables. For more videos visit http://www.mysecretmathtutor.com

From playlist Statistics

Video thumbnail

Atomic Absorption Spectrometer Teardown

Teardown of an Atomic Absorption Spectrometer.

From playlist Teardowns

Video thumbnail

Live CEOing Ep 113: Language Design in Wolfram Language

Watch Stephen Wolfram and teams of developers in a live, working, language design meeting. This episode is about Language Design in the Wolfram Language.

From playlist Behind the Scenes in Real-Life Software Design

Video thumbnail

Live CEOing Ep 179: Image and Audio in Wolfram Language

Watch Stephen Wolfram and teams of developers in a live, working, language design meeting. This episode is about Image and Audio in the Wolfram Language.

From playlist Behind the Scenes in Real-Life Software Design

Video thumbnail

CDIS 4017 - Clinical Instrumentation Part 1 (done)

Chaya Guntupalli (Nanjundeswaran) Ph.D. CDIS 4017 - Speech and Hearing Science I ETSU Online Programs - http://www.etsu.edu/online

From playlist ETSU: CDIS 4017 - Speech and Hearing Science I | CosmoLearning Audiology

Video thumbnail

Spectrogram Examples [Matlab]

We discuss how to compute the spectrogram in Matlab. Book Website: http://databookuw.com Book PDF: http://databookuw.com/databook.pdf These lectures follow Chapter 2 from: "Data-Driven Science and Engineering: Machine Learning, Dynamical Systems, and Control" by Brunton and Kutz Amazo

From playlist Data-Driven Science and Engineering

Video thumbnail

Spectrogram Examples [Python]

This video describes how to compute the Spectrogram in Python. Book Website: http://databookuw.com Book PDF: http://databookuw.com/databook.pdf These lectures follow Chapter 2 from: "Data-Driven Science and Engineering: Machine Learning, Dynamical Systems, and Control" by Brunton and

From playlist Data-Driven Science and Engineering

Video thumbnail

End-to-End Adversarial Text-to-Speech (Paper Explained)

Text-to-speech engines are usually multi-stage pipelines that transform the signal into many intermediate representations and require supervision at each step. When trying to train TTS end-to-end, the alignment problem arises: Which text corresponds to which piece of sound? This paper uses

From playlist Papers Explained

Video thumbnail

PHO121 - Speech Analysis

This E-Lecture first discusses the central methods of sound analysis and then shows how spectrograms are produced and analyzed. This includes a discussion of the formant frequencies of vowels, the acoustic characteristics of consonants and the construction of an acoustic vowel chart.

From playlist VLC102 - Speech Science

Video thumbnail

Live CEOing Ep 115: Language Design in Wolfram Language

Watch Stephen Wolfram and teams of developers in a live, working, language design meeting. This episode is about Language Design in the Wolfram Language.

From playlist Behind the Scenes in Real-Life Software Design

Video thumbnail

Specular vs. Diffuse Reflection

This video tutorial lesson discusses the difference between diffuse and specular reflection. The cause of each and the resulting consequences are explained. Law of Reflection video (referenced on Slide 3) can be found at ... https://youtu.be/0Zbkt6K1kbM You can find more information that

From playlist Reflection and Mirrors

Video thumbnail

Tacotron 2 - THE BEST TEXT TO SPEECH AI YET!

In this video, I am going to talk about the new Tacotron 2- google's the text to speech system that is as close to human speech till date. If you like the video, SUBSCRIBE for more awesome content. Research paper: https://arxiv.org/pdf/1712.05884.pdf Read some of my AI answers on Quora:

From playlist Deep Learning Research Papers

Related pages

Decibel | Wavelet transform | Scattering parameters | Window function | Band-pass filter | Logarithm | Fourier analysis | Time | Sampling (signal processing) | Time–frequency representation | Generalized spectrogram | Reassignment method | Recurrent neural network | Frequency | Least-squares spectral analysis | Phase vocoder | Spectral density | Speech processing | Magnitude (mathematics) | GW170817 | Digital signal processing | Short-time Fourier transform | Time series | Steganography | Fourier transform | Optical spectrometer