Statistical ratios | Summary statistics for contingency tables

Diagnostic odds ratio

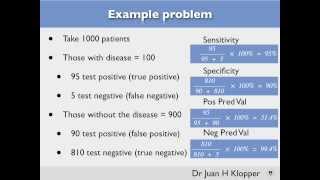
In medical testing with binary classification, the diagnostic odds ratio (DOR) is a measure of the effectiveness of a diagnostic test. It is defined as the ratio of the odds of the test being positive if the subject has a disease relative to the odds of the test being positive if the subject does not have the disease. The rationale for the diagnostic odds ratio is that it is a single indicator of test performance (like accuracy and Youden's J statistic) but which is independent of prevalence (unlike accuracy) and is presented as an odds ratio, which is familiar to medical practitioners. (Wikipedia).

Diagnostic odds ratio
Video thumbnail

Chapter 12 Sensitivity Specificity Predictive Values Odds Ratios

Ever wandered how to calculate sensitivity, specificity, positive and negative predictive values or odds ratios or even simply what these terms mean? Watch this short lecture.

From playlist Medical Statistics

Video thumbnail

Odds Ratios and Log(Odds Ratios), Clearly Explained!!!

Odds Ratios and Log(Odds Ratios) are like R-Squared - they describe a relationship between two things. And just like R-Squared, you need to determine if this relationship is statistically significant. This StatQuest goes over all these details so that you are ready for any odds ratio and l

From playlist StatQuest

Video thumbnail

Statistics 5_1 Confidence Intervals

In this lecture explain the meaning of a confidence interval and look at the equation to calculate it.

From playlist Medical Statistics

Video thumbnail

The Likelihood Ratio Test

http://AllSignalProcessing.com for more great signal-processing content: ad-free videos, concept/screenshot files, quizzes, MATLAB and data files. The likelihood ratio test maximizes the probability of correctly deciding hypothesis H_1 is true for any given probability of deciding H_0 is

From playlist Estimation and Detection Theory

Video thumbnail

Find Probability from Odds

This video explains how to determine the probability of an outcome given the odds of an outcome. http://mathispower4u.com

From playlist Probability

Video thumbnail

Computing z-scores(standard scores) and comparing them

Please Subscribe here, thank you!!! https://goo.gl/JQ8Nys Computing z-scores(standard scores) and comparing them

From playlist Statistics

Video thumbnail

Bayes, Medical Diagnostics, and Nomograms

(April 11, 2012) Joe Marasco shares his beliefs on how modern diagnostics and medical testing can be changed to give patients a clearer understanding of the results. He suggests implementing a new protocol using Bayes theorem and certain medical technologies to help explain testing results

From playlist Engineering

Video thumbnail

Dark Energy Beyond A by Anjan Ananda Sen

Candles of Darkness DATE: 05 June TIME2017 to 09 June 2017 VENUE:Ramanujan Lecture Hall, ICTS Bangalore DARK MATTER AND THE SEARCH FOR PHYSICS BEYOND THE STANDARD MODEL "Darkness is your candle. Your boundaries are your quest."- Jalal-ud-din Rumi of Balkh (1207 - 1273) High energy Phys

From playlist Candles of Darkness

Video thumbnail

Calculate a Confidence Interval for a Population Proportion (Basic)

This example explains how to calculator a confidence interval for a population proportion.

From playlist Confidence Intervals

Video thumbnail

Hypothesis Test: Two Population Proportions

This video explains how to conduct a hypothesis test on two population proportions. http://mathispower4u.com

From playlist Hypothesis Test with Two Samples

Video thumbnail

Data Science - Part XV - MARS, Logistic Regression, & Survival Analysis

For downloadable versions of these lectures, please go to the following link: http://www.slideshare.net/DerekKane/presentations https://github.com/DerekKane/YouTube-Tutorials This lecture provides an overview on extending the regression concepts brought forth in previous lectures. We wi

From playlist Data Science

Video thumbnail

VassarStats - Clinical Block 1 Example

Lecturer: Dr. Erin M. Buchanan Missouri State University Spring 2017 This video covers the concepts and how to calculate: prevalence, sensitivity, specificity, likelihood ratios, and ROC curves. Lecture materials and assignments available at statisticsofdoom.com. https://statisticsofdo

From playlist Advanced Statistics Videos

Video thumbnail

11. Differential Diagnosis

MIT 6.S897 Machine Learning for Healthcare, Spring 2019 Instructor: Peter Szolovits View the complete course: https://ocw.mit.edu/6-S897S19 YouTube Playlist: https://www.youtube.com/playlist?list=PLUl4u3cNGP60B0PQXVQyGNdCyCTDU1Q5j Prof. Szolovits explains differential diagnosis, the disti

From playlist MIT 6.S897 Machine Learning for Healthcare, Spring 2019

Video thumbnail

Jiancang Zhuang - Estimation, diagnostics, and extensions of nonparametric Hawkes processes

Jiancang Zhuang (Institute of Statistical Mathematics, Tokyo) presents "Estimation, diagnostics, and extensions of nonparametric Hawkes processes", 2 December 2022.

From playlist Statistics Across Campuses

Video thumbnail

The Computer Chronicles - Diagnostic Software (1992)

Special thanks to archive.org for hosting these episodes. Downloads of all these episodes and more can be found at: http://archive.org/details/computerchronicles

From playlist Computer Chronicles Episodes on Software

Video thumbnail

Finding the z-score of x with the formula

Please Subscribe here, thank you!!! https://goo.gl/JQ8Nys Finding the z-score of x with the formula

From playlist Statistics

Video thumbnail

Data Science - Part IV - Regression Analysis and ANOVA Concepts

For downloadable versions of these lectures, please go to the following link: http://www.slideshare.net/DerekKane/presentations https://github.com/DerekKane/YouTube-Tutorials This lecture provides an overview of linear regression analysis, interaction terms, ANOVA, optimization, log-leve

From playlist Data Science

Video thumbnail

Environmental Contributions to Risk for Autism- State-of-the-Science in 2013

Recorded on February 13, 2013. Presenteed by Irva Hertz-Picciotto, Ph.D., M.P.H. As a proud member of the OCW Consortium, the University of California, Irvine strives to play a significant role in the contribution to the social welfare of the state, the nation and the world by making high

From playlist Graduate Seminar in Public Health 2012-2013

Video thumbnail

Z Interval [Confidence Interval] for a Proportion

Calculating, understanding, and interpreting a Z Interval [confidence interval] for an unknown population proportion

From playlist Unit 8: Hypothesis Tests & Confidence Intervals for Single Means & for Single Proportions

Related pages

Youden's J statistic | Likelihood ratios in diagnostic testing | Confidence interval | Meta-analysis | Natural logarithm | Inverse-variance weighting | Odds ratio | Prevalence | Evaluation of binary classifiers | Exponential function | Receiver operating characteristic | Sensitivity and specificity | Binary classification | Confusion matrix | Normal distribution | Logit