
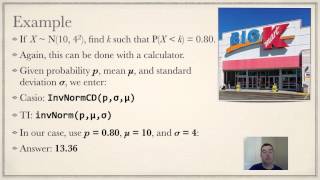
Determining values of a variable at a particular percentile in a normal distribution
From playlist Unit 2: Normal Distributions
The dispersion of data by means of the standard deviation.
From playlist Medical Statistics

The Normal Distribution (1 of 3: Introductory definition)
More resources available at www.misterwootube.com
From playlist The Normal Distribution

Quantile Normalization, Clearly Explained!!!
Quantile Normalization lets us compare data that has all kinds of noise in it. It sounds fancy but is really super simple. Essentially you just sort each sample data from high to low. If your samples are rows, you then replace the values with the average of each row. BAM! For a complete i
From playlist StatQuest

Normal Distribution: Find Probability Given Z-scores Using a Free Online Calculator
This video explains how to determine normal distribution probabilities given z-scores using a free online calculator. http://dlippman.imathas.com/graphcalc/graphcalc.html
From playlist The Normal Distribution
Normal Distribution: Find Probability Given Z-scores Using a Free Online Calculator (MOER/MathAS)
This video explains how to determine normal distribution probabilities given z-scores using a free online calculator. https://oervm.s3-us-west-2.amazonaws.com/stats/probs.html
From playlist The Normal Distribution
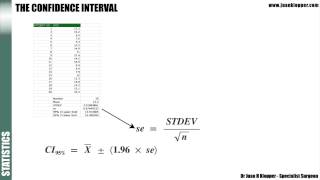
Statistics 5_1 Confidence Intervals
In this lecture explain the meaning of a confidence interval and look at the equation to calculate it.
From playlist Medical Statistics

Quantile-Quantile Plots (QQ plots), Clearly Explained!!!
Quantile-Quantile (QQ) plots are used to determine if data can be approximated by a statistical distribution. For example, you might collect some data and wonder if it is normally distributed. A QQ plot will help you answer that question. You can also use QQ plots to compare to different d
From playlist StatQuest
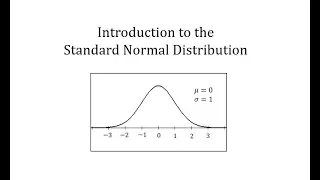
Introduction to the Standard Normal Distribution
This video introduces the standard normal distribution http://mathispower4u.com
From playlist The Normal Distribution
Jamovi 1.8/2.0 Tutorial: distrACTION Module (Episode 33)
In this Jamovi tutorial, I go through another educational add-on module called distrACTION. It has four continuous and one discrete distribution to show what happens to the cumulative density function and the quartile density function when you modify parameters. This module can be useful f
From playlist Jamovi Tutorials
Probability functions: pdf, CDF and inverse CDF (FRM T2-1)
[Here is my XLS @ http://trtl.bz/2AgvfRo] A function is a viable probability function if it has a valid CDF (i.e., is bounded by zero and one) which is the integral of the probability density function (pdf). The inverse CDF (aka, quantile function) returns the quantile associated with a pr
From playlist Quantitative Analysis (FRM Topic 2)
XGBoost Part 4 (of 4): Crazy Cool Optimizations
This video covers all kinds of extra optimizations that XGBoost uses when the training dataset is huge. So we'll talk about the Approximate Greedy Algorithm, Parallel Learning, The Weighted Quantile Sketch, Sparsity-Aware Split Finding (i.e. how XGBoost deals with missing data and uses def
From playlist StatQuest
How do I... INTERPRET A Q-Q PLOT in Jamovi? (2022)
There's a lot options to see if your samples are normally distributed -- one of those is a Q-Q Plot. How do I interpret that plot? How is it useful? I have these answers and more in this next episode of learning stats with Jamovi! Jamovi stats: https://www.jamovi.org/ NOTE: My tutorials
From playlist Jamovi 2022 Tutorials
Expected shortfall: approximating continuous, with code (ES continous, FRM T5-03)
In my previous video, I showed you how we retrieve expected shortfall under the simplest possible discrete case. That was a simple historical simulation, but that was discrete. In this video, I'm going to review expected shortfall when the distribution is continuous. Specifically, I will u
From playlist Market Risk (FRM Topic 5)

FRM: Quantile function (Inverse CDF)
Here is the spreadsheet I used (and that shows the same recursive solution to all three distributions): http://db.tt/gyrCxFU5 The quantile function, which is the inverted cumulative distribution function, gives us the value (X) that answers the question, with confidence of (P%), what is th
From playlist Operational Risk Analytics

ES is a complement to value at risk (VaR). ES is the average loss in the tail; i.e., the expected loss *conditional* on the loss exceeding the VaR quantile. For more financial risk videos, visit our website! http://www.bionicturtle.com
From playlist Tail

From playlist Contributed talks One World Symposium 2020

Quantile Regression - EXPLAINED!
Quantile regression - Hope the explanation wasn't too all over the place Follow me on M E D I U M: https://towardsdatascience.com/likelihood-probability-and-the-math-you-should-know-9bf66db5241b CODE: https://github.com/ajhalthor/quantile-regression
From playlist Code Machine Learning