(PP 6.1) Multivariate Gaussian - definition
Introduction to the multivariate Gaussian (or multivariate Normal) distribution.
From playlist Probability Theory

This calculus 2 video tutorial provides a basic introduction into probability density functions. It explains how to find the probability that a continuous random variable such as x in somewhere between two values by evaluating the definite integral from a to b. The probability is equival
From playlist New Calculus Video Playlist
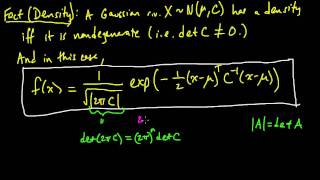
(PP 6.4) Density for a multivariate Gaussian - definition and intuition
The density of a (multivariate) non-degenerate Gaussian. Suggestions for how to remember the formula. Mathematical intuition for how to think about the formula.
From playlist Probability Theory
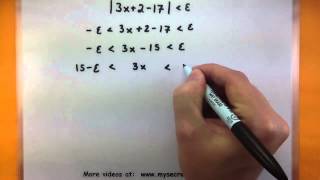
Calculus - Find the limit of a function using epsilon and delta
This video shows how to use epsilon and delta to prove that the limit of a function is a certain value. This particular video uses a linear function to highlight the process and make it easier to understand. Later videos take care of more complicated functions and using epsilon and delta
From playlist Calculus
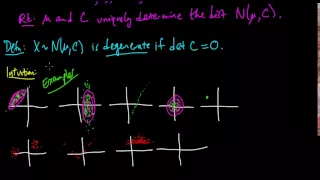
(PP 6.2) Multivariate Gaussian - examples and independence
Degenerate multivariate Gaussians. Some sketches of examples and non-examples of Gaussians. The components of a Gaussian are independent if and only if they are uncorrelated.
From playlist Probability Theory

Probability Distribution Functions
We explore the idea of continuous probability density functions in a classical context, with a ball bouncing around in a box, as a preparation for the study of wavefunctions in quantum mechanics.
From playlist Quantum Mechanics Uploads
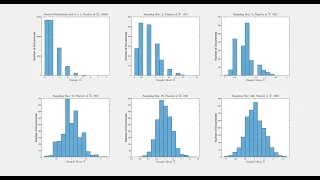
Central Limit Theorem: Verification using Poisson Distribution with Lambda = 1
This script is to verify the Central Limit Theorem in probability theory or statistics. The Central Limit Theorem states that, regardless of the distribution of the population, the sampling distribution of the sample means, assuming all samples are identical in size, will approach a norma
From playlist Probability Theory/Statistics

Fastest Identification in Linear Systems by Alexandre Proutiere
Program Advances in Applied Probability II (ONLINE) ORGANIZERS: Vivek S Borkar (IIT Bombay, India), Sandeep Juneja (TIFR Mumbai, India), Kavita Ramanan (Brown University, Rhode Island), Devavrat Shah (MIT, US) and Piyush Srivastava (TIFR Mumbai, India) DATE: 04 January 2021 to 08 Januar
From playlist Advances in Applied Probability II (Online)
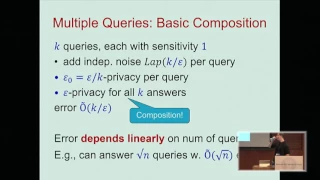
Composition: The Key to Differential Privacy is Success - Guy Rothblum
Differential Privacy Symposium: Four Facets of Differential Privacy Saturday, November 12, 2016 https://www.ias.edu/differential-privacy More videos on http://video.ias.edu
From playlist Differential Privacy Symposium - November 12, 2016
Hugo Duminil-Copin - 4/4 Triviality of the 4D Ising Model
We prove that the scaling limits of spin fluctuations in four-dimensional Ising-type models with nearest-neighbor ferromagnetic interaction at or near the critical point are Gaussian. A similar statement is proven for the λ4 fields over R4 with a lattice ultraviolet cutoff, in the limit of
From playlist Hugo Duminil-Copin - Triviality of the 4D Ising Model

Daniel Dadush: Probabilistic analysis of the simpler method and polytope diameter
In this talk, I will overview progress in our probabilistic understanding of the (shadow vertex) simplex method in three different settings: smoothed polytopes (whose data is randomly perturbed), well-conditioned polytopes (e.g., TU systems), and random polytopes with constraints drawn uni
From playlist Workshop: Tropical geometry and the geometry of linear programming
Dmitryi Bilyk: Uniform distribution, lacunary Fourier series, and Riesz products
Uniform distribution theory, which originated from a famous paper of H. Weyl, from the very start has been closely connected to Fourier analysis. One of the most interesting examples of such relations is an intricate similarity between the behavior of discrepancy (a quantitative measure of
From playlist HIM Lectures: Trimester Program "Harmonic Analysis and Partial Differential Equations"
Graph Sparsification by Edge-Connectivity and Random Spanning Trees - Nick Harvey
Nick Harvey University of Waterloo April 11, 2011 For more videos, visit http://video.ias.edu
From playlist Mathematics

Selection of the Best System using large deviations, and multi-arm Bandits by Sandeep Juneja
Large deviation theory in statistical physics: Recent advances and future challenges DATE: 14 August 2017 to 13 October 2017 VENUE: Madhava Lecture Hall, ICTS, Bengaluru Large deviation theory made its way into statistical physics as a mathematical framework for studying equilibrium syst
From playlist Large deviation theory in statistical physics: Recent advances and future challenges
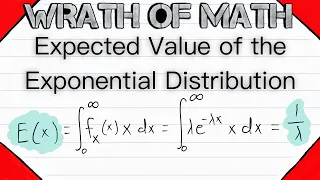
Expected Value of the Exponential Distribution | Exponential Random Variables, Probability Theory
What is the expected value of the exponential distribution and how do we find it? In today's video we will prove the expected value of the exponential distribution using the probability density function and the definition of the expected value for a continuous random variable. It's gonna b
From playlist Probability Theory
Chao Gao: Statistical Optimality and Algorithms for Top-K Ranking - Lecture 1
CIRM VIRTUAL CONFERENCE The second presentation will be focused on total ranking. The problem is to find a permutation vector to rank the entire set of players. We will show that the minimax rate of the problem with respect to the Kendall’s tau loss exhibits a transition between an expon
From playlist Virtual Conference

Ex: Determine Conditional Probability from a Table
This video provides two examples of how to determine conditional probability using information given in a table.
From playlist Probability

Cobra Walks by Rajmohan Rajaraman
Games, Epidemics and Behavior URL: http://www.icts.res.in/discussion_meeting/geb2016/ DATES: Monday 27 Jun, 2016 - Friday 01 Jul, 2016 VENUE : Madhava lecture hall, ICTS Bangalore DESCRIPTION: The two main goals of this Discussion Meeting are: 1. To explore the foundations of policy d
From playlist Games, Epidemics and Behavior
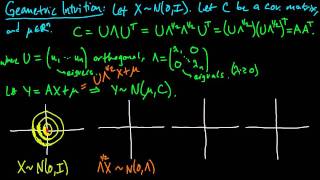
(PP 6.6) Geometric intuition for the multivariate Gaussian (part 1)
How to visualize the effect of the eigenvalues (scaling), eigenvectors (rotation), and mean vector (shift) on the density of a multivariate Gaussian.
From playlist Probability Theory