
Statistics - How to find outliers
This video covers how to find outliers in your data. Remember that an outlier is an extremely high, or extremely low value. We determine extreme by being 1.5 times the interquartile range above Q3 or below Q1. For more videos visit http://www.mysecretmathtutor.com
From playlist Statistics
Determine Outliers by Hand (Even)
This video explains how to determine outliers of a data set by hand with an even number of data values. http://mathispower4u.com
From playlist Statistics: Describing Data

Determine Outliers by Hand (Odd)
This video explains how to determine outliers of a data set by hand with an odd number of data values. http://mathispower4u.com
From playlist Statistics: Describing Data

Definition of an Outlier in Statistics MyMathlab Homework Problem
Please Subscribe here, thank you!!! https://goo.gl/JQ8Nys Definition of an Outlier in Statistics MyMathlab Homework Problem
From playlist Statistics

Assumptions: Calling Out OUTLIERS – Problems and Causes (6-8)
An Outlier is a rare or extreme high or low score that does not fit the overall pattern of the distribution. Single Items Outliers tend to occur on biometrics and demographics. Univariate Outliers are extreme high or low scores on a single scale. Multivariate Outliers are extreme high or l
From playlist Depicting Distributions from Boxplots to z-Scores (WK 6 QBA 237)

Determine Outliers on the TI-84
This video explains how to determine outliers of a data set using the box plot tool on the TI-84.
From playlist Statistics: Describing Data
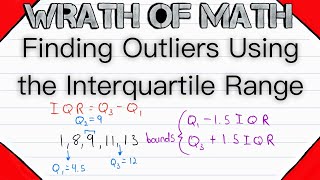
Finding Outliers using Interquartile Range | Statistics, IQR, Quartiles
How do we find outliers of a data set using the interquartile range? This is done using a simple rule, any value less than Q1-1.5*IQR is an outlier, and any value greater than Q3+1.5*IQR is an outlier. We'll go through the step by step process of finding outliers using IQR in today's video
From playlist Statistics

Characterising a Dataset (1 of 3: Discussing outliers)
More resources available at www.misterwootube.com
From playlist Descriptive Statistics & Bivariate Data Analysis


R - Binary Logistic Multilevel Models
Lecturer: Dr. Erin M. Buchanan Harrisburg University of Science and Technology Fall 2019 This video covers binary logistic regression + multilevel models in R using glmer and the lme4 package. I cover an example of a project that our research lab has under review. We talk about assumption
From playlist Advanced Statistics Videos
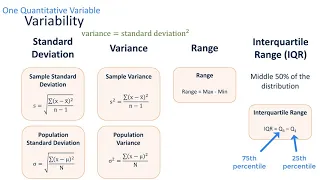
Table of Content 0:18 Lesson 2 topics 0:51 One categorical variable 1:12 Proportion & odds 7:32 Visual representations (frequency table, pie chart, bar chart) 11:39 One quantitative variable 12:00 Central tendency 16:45 Variability 23:46 Five number summary 26:59 Visual representations (hi
From playlist STAT 200 Lectures (OER)
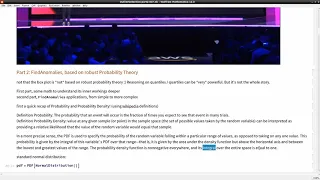
Introduction to Outlier Detection Methods (Part 2) - Wolfram Livecoding Session
Andreas Lauschke, a senior mathematical programmer, live-demos key Wolfram Language features useful in data science. In this seventh session, the introduction to outlier detection methods continues, and the basics of continuous probability theory are recapped. Then learn about the built-in
From playlist Data Science with Andreas Lauschke

Gap probabilities and Riemann-Hilbert problems in determinantal random point processes - Bertola
Marco Bertola Concordia University November 5, 2013 For more videos, please visit http://video.ias.edu
From playlist Mathematics

MIT 6.041 Probabilistic Systems Analysis and Applied Probability, Fall 2010 View the complete course: http://ocw.mit.edu/6-041F10 Instructor: John Tsitsiklis License: Creative Commons BY-NC-SA More information at http://ocw.mit.edu/terms More courses at http://ocw.mit.edu
From playlist MIT 6.041SC Probabilistic Systems Analysis and Applied Probability, Fall 2013
Descriptive Statistics for Scale Data in SPSS 27 - Statistics with SPSS for Beginners (5 of 8)
Dr. Daniel and Diva explain scale variables and show you how to display them in tables, as numbers, and with graphs. You learn a shortcut to display descriptive statistics quickly, then how to display descriptive statistics using the FREQUENCIES command. We will recode a scale variable i
From playlist Introduction to Statistics with IBM SPSS 27 for Beginners (with Puppies)
The Mean – The Mathematical Measure of Central Tendency (5-4)
Mean is the score located at the mathematical center of the distribution. It’s the most commonly used measure with interval and ratio data, and is most likely to be called the “average”. When the scores in the dataset form a normal distribution, mean equals median equals mode. Later, we wi
From playlist WK5 Measures of Central Tendency (Mean, Median, Mode) - Online Statistics for the Flipped Classroom

Matplotlib Tutorial (Part 7): Scatter Plots
In this video, we will be learning how to create scatter plots in Matplotlib. This video is sponsored by Brilliant. Go to https://brilliant.org/cms to sign up for free. Be one of the first 200 people to sign up with this link and get 20% off your premium subscription. In this Python Prog
From playlist Matplotlib Tutorials

How to Find Outliers (IQR and Tukey Method)
What is an outlier? How to find outliers with the interquartile range and Tukey's method.
From playlist Basic Statistics (Descriptive Statistics)

Lecture 12 - Principles of Visualizing Data
This is Lecture 12 of the CSE519 (Data Science) course taught by Professor Steven Skiena [http://www.cs.stonybrook.edu/~skiena/] at Stony Brook University in 2016. The lecture slides are available at: http://www.cs.stonybrook.edu/~skiena/519 More information may be found here: http://www
From playlist CSE519 - Data Science Fall 2016