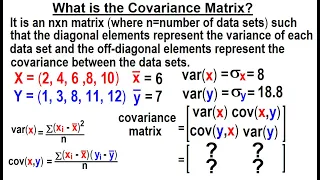
Boundary layer meteorology | Covariance and correlation
The eddy covariance (also known as eddy correlation and eddy flux) is a key atmospheric measurement technique to measure and calculate vertical turbulent fluxes within atmospheric boundary layers. The method analyses high-frequency wind and scalar atmospheric data series, gas, energy, and momentum, which yields values of fluxes of these properties. It is a statistical method used in meteorology and other applications (micrometeorology, oceanography, hydrology, agricultural sciences, industrial and regulatory applications, etc.) to determine exchange rates of trace gases over natural ecosystems and agricultural fields, and to quantify gas emissions rates from other land and water areas. It is frequently used to estimate momentum, heat, water vapour, carbon dioxide and methane fluxes. The technique is also used extensively for verification and tuning of global climate models, mesoscale and weather models, complex biogeochemical and ecological models, and remote sensing estimates from satellites and aircraft. The technique is mathematically complex, and requires significant care in setting up and processing data. To date, there is no uniform terminology or a single methodology for the eddy covariance technique, but much effort is being made by flux measurement networks (e.g., FluxNet, Ameriflux, ICOS, CarboEurope, Fluxnet Canada, OzFlux, NEON, and iLEAPS) to unify the various approaches. The technique has additionally proven applicable under water to the benthic zone for measuring oxygen fluxes between the sea floor and overlying water. In these environments, the technique is generally known as the eddy correlation technique, or just eddy correlation. Oxygen fluxes are extracted from raw measurements largely following the same principles as used in the atmosphere, and they are typically used as a proxy for carbon exchange, which is important for local and global carbon budgets. For most benthic ecosystems, eddy correlation is the most accurate technique for measuring in-situ fluxes. The technique's development and its applications under water remains a fruitful area of research. (Wikipedia).
Covariance (1 of 17) What is Covariance? in Relation to Variance and Correlation
Visit http://ilectureonline.com for more math and science lectures! To donate:a http://www.ilectureonline.com/donate https://www.patreon.com/user?u=3236071 We will learn the difference between the variance and the covariance. A variance (s^2) is a measure of how spread out the numbers of
From playlist COVARIANCE AND VARIANCE
This educational video delves into how you quantify a linear statistical relationship between two variables using covariance! #statistics #probability #SoME2 This video gives a visual and intuitive introduction to the covariance, one of the ways we measure a linear statistical relation
From playlist Summer of Math Exposition 2 videos
Covariance (8 of 17) What is the Correlation Coefficient?
Visit http://ilectureonline.com for more math and science lectures! To donate:a http://www.ilectureonline.com/donate https://www.patreon.com/user?u=3236071 We will learn what is and how to find the correlation coefficient of 2 data sets and see how it corresponds to the graph of the data
From playlist COVARIANCE AND VARIANCE
Covariance Definition and Example
What is covariance? How do I find it? Step by step example of a solved covariance problem for a sample, along with an explanation of what the results mean and how it compares to correlation. 00:00 Overview 03:01 Positive, Negative, Zero Correlation 03:19 Covariance for a Sample Example
From playlist Correlation
Covariance (5 of 17) What is the Covariance Matrix?
Visit http://ilectureonline.com for more math and science lectures! To donate:a http://www.ilectureonline.com/donate https://www.patreon.com/user?u=3236071 We will learn the covariance matrix is an nxn matrix (where n=number of data sets) such that the diagonal elements represents the va
From playlist COVARIANCE AND VARIANCE
How to find Correlation in Excel 2013
Visit us at http://www.statisticshowto.com for more FREE statistics and Excel videos.
From playlist Excel for Statistics
Assimilating Data into Physical Models - Christopher KRT Jones
CAARMS Topic: Assimilating Data into Physical Models Speaker: Christopher KRT Jones Affiliation: University of North Carolina at Chapel Hill Date: July 12, 2018 For more videos, please visit http://video.ias.edu
From playlist Mathematics
Assimilation of Lagrangian data - Chris Jones
PROGRAM: Data Assimilation Research Program Venue: Centre for Applicable Mathematics-TIFR and Indian Institute of Science Dates: 04 - 23 July, 2011 DESCRIPTION: Data assimilation (DA) is a powerful and versatile method for combining observational data of a system with its dynamical mod
From playlist Data Assimilation Research Program
Applied Math Perspectives on Stochastic Climate Models ( 2 ) - Andrew J. Majda
Lecture 2: Applied Math Perspectives on Stochastic Climate Models Abstract: We are entering a new era of Stochastic Climate Modeling. Such an approach is needed for several reasons: 1) to model crucial poorly represented processes in contemporary comprehensive computer models such as inte
From playlist Mathematical Perspectives on Clouds, Climate, and Tropical Meteorology
Boreal Summer Intraseasonal Variability (Special Tutorial 1) by Eric Daniel Maloney
DISCUSSION MEETING: AIR-SEA INTERACTIONS IN THE BAY OF BENGAL FROM MONSOONS TO MIXING ORGANIZERS : Eric D'Asaro, Rama Govindarajan, Manikandan Mathur, Debasis Sengupta, Emily Shroyer, Jai Sukhatme and Amit Tandon DATE & TIME : 18 February 2019 to 23 February 2019 VENUE : Ramanujan Lecture
From playlist Air-sea Interactions in The Bay of Bengal From Monsoons to Mixing 2019
Computational prediction technologies for turbulent flows by Charles Meneveau
Turbulence from Angstroms to light years DATE:20 January 2018 to 25 January 2018 VENUE:Ramanujan Lecture Hall, ICTS, Bangalore The study of turbulent fluid flow has always been of immense scientific appeal to engineers, physicists and mathematicians because it plays an important role acr
From playlist Turbulence from Angstroms to light years
Covariance (12 of 17) Covariance Matrix wth 3 Data Sets and Correlation Coefficients
Visit http://ilectureonline.com for more math and science lectures! To donate:a http://www.ilectureonline.com/donate https://www.patreon.com/user?u=3236071 We will find the correlation coefficients of the 3 data sets form the previous 2 videos. Next video in this series can be seen at:
From playlist COVARIANCE AND VARIANCE
Covariance (14 of 17) Covariance Matrix "Normalized" - Correlation Coefficient
Visit http://ilectureonline.com for more math and science lectures! To donate:a http://www.ilectureonline.com/donate https://www.patreon.com/user?u=3236071 We will find the “normalized” matrix (or the correlation coefficients) from the covariance matrix from the previous video using 3 sa
From playlist COVARIANCE AND VARIANCE
Covariance (11 of 17) Covariance Matrix with 3 Data Sets (Part 2)
Visit http://ilectureonline.com for more math and science lectures! To donate:a http://www.ilectureonline.com/donate https://www.patreon.com/user?u=3236071 We will find the covariance matrix of 3 data sets. Part 2 Next video in this series can be seen at: https://youtu.be/O5v8ID5Cz_8
From playlist COVARIANCE AND VARIANCE
Data Driven Methods for Complex Turbulent Systems ( 3 ) - Andrew J. Majda
Lecture 3: Data Driven Methods for Complex Turbulent Systems Abstract: An important contemporary research topic is the development of physics constrained data driven methods for complex, large-dimensional turbulent systems such as the equations for climate change science. Three new approa
From playlist Mathematical Perspectives on Clouds, Climate, and Tropical Meteorology
Overview of Approaches to Data Assimilation - Christopher Jones
PROGRAM: Data Assimilation Research Program Venue: Centre for Applicable Mathematics-TIFR and Indian Institute of Science Dates: 04 - 23 July, 2011 DESCRIPTION: Data assimilation (DA) is a powerful and versatile method for combining observational data of a system with its dynamical mod
From playlist Data Assimilation Research Program
Accelerating and improving climate models with hybrid AI approaches by Tapio Schneider
DISCUSSION MEETING: WORKSHOP ON CLIMATE STUDIES (HYBRID) ORGANIZERS: Rama Govindarajan (ICTS-TIFR, India), Sandeep Juneja (TIFR, India), Ramalingam Saravanan (Texas A&M University, USA) and Sandip Trivedi (TIFR, India) DATE : 01 March 2022 to 03 March 2022 VENUE: Ramanujan Lecture Hall
From playlist Workshop on Climate Studies - 2022
Coupled data assimilation-challenges and practicalities - Browne - Workshop 2 - CEB T4 2022
Browne (ECMWF, UK) / 15.11.2019 Coupled data assimilation- challenges and practicalities ---------------------------------- Vous pouvez nous rejoindre sur les réseaux sociaux pour suivre nos actualités. Facebook : https://www.facebook.com/InstitutHenriPoincare/ Twitter : https://
From playlist 2019 - T3 - The Mathematics of Climate and the Environment
Covariance (6 of 17) Example of the Covariance Matrix - EX 1
Visit http://ilectureonline.com for more math and science lectures! To donate:a http://www.ilectureonline.com/donate https://www.patreon.com/user?u=3236071 We will find the covariance matrix of 2 data sets. Example 1 Next video in this series can be seen at: https://youtu.be/9DscP6F5CGs
From playlist COVARIANCE AND VARIANCE
DDPS | Physics-Guided Deep Learning for Dynamics Forecasting
In this talk from July 9, 2021, University of California, San Diego Computer Science Ph.D. student Rui Wang discusses physics-based modeling with deep learning. Description: Modeling complex physical dynamics is a fundamental task in science and engineering. There is a growing need for in
From playlist Data-driven Physical Simulations (DDPS) Seminar Series